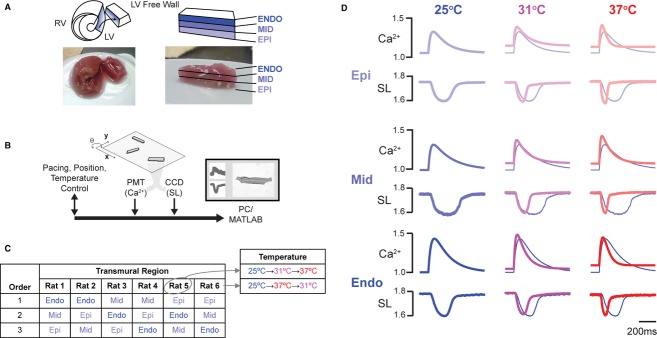
Figure 1.

Experiment overview and example data. (A) Schematic (top) and images (bottom) of separation of transmural regions from the LV free wall. After hearts were removed from the cannulae, the LV free wall was dissected (left) and separated into three transmural regions: subepicardium (Epi), midmyocardium (Mid), and subendocardium (Endo) of even thickness (right), dissociated, and myocytes were isolated from each region. (B) System Schematic. Calcium (Ca2+) transients and sarcomere length (SL) profiles were measured using a photomultiplier tube (PMT) and a CCD camera, respectively. A computer-controlled system allowed repeated measurements of multiple cells at different temperatures. (C) Balanced experimental design. The three transmural regions were analyzed in different orders each of nine rats to minimize the effect of time from isolation. Temperature order was also altered for alternating rats. For example, cells from Rat 5 were taken from 25°C to 31°C and finally 37°C, whereas cells from Rat 6 were taken from 25°C to 31°C and finally 31°C. (D) Example records. Data recorded at 25°C repeated for each transmural region for comparison (thin line). For clarity, calcium data are plotted as best fits to a five-parameter function (Rice et al. 2008) rather than as raw experimental records.
