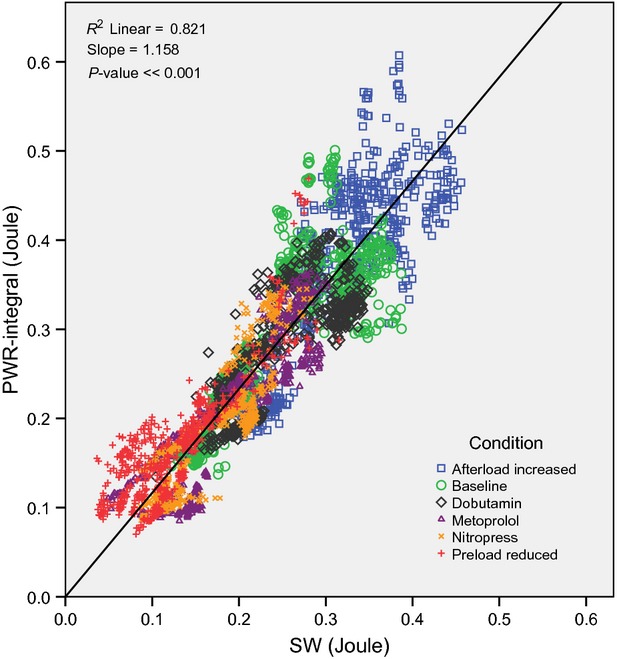
Figure 4.

Correlation plot for all the animals in the same chart, comparing SW to the PWR integral, with the units in Joules on both axes. Each mark is one cardiac cycle, and each animal is coded with an individual symbol. All conditions are included in the plot: baseline, reduced preload, increased afterload, dobutamine infusion, nitroprusside infusion, and metoprolol bolus injection, each coded with a separate color. The linear regression line for the full material was added and calculated with the assumption that SW = 0 will yield PWR = 0.
