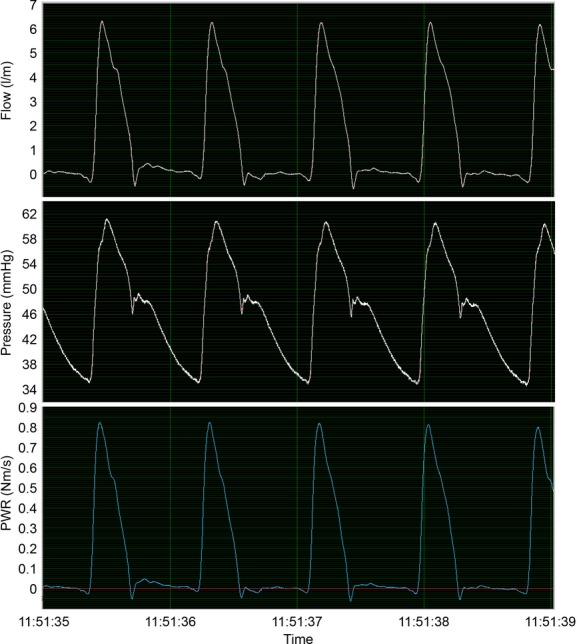
Figure 5.

Pressure data from the aortic micromanometer is illustrated on top, displayed in mmHg; the flow from the transit time probe on the ascending aorta is displayed in the middle, and the resulting product PWR is displayed at the bottom. The software calculated the integral of the PWR curve per cycle. Because flow has a much higher relative variation during a cycle than pressure, flow will dominate the shape of the PWR curve. In addition, because flow is practically zero during diastole, the diastolic pressure will not have much effect on the PWR.
