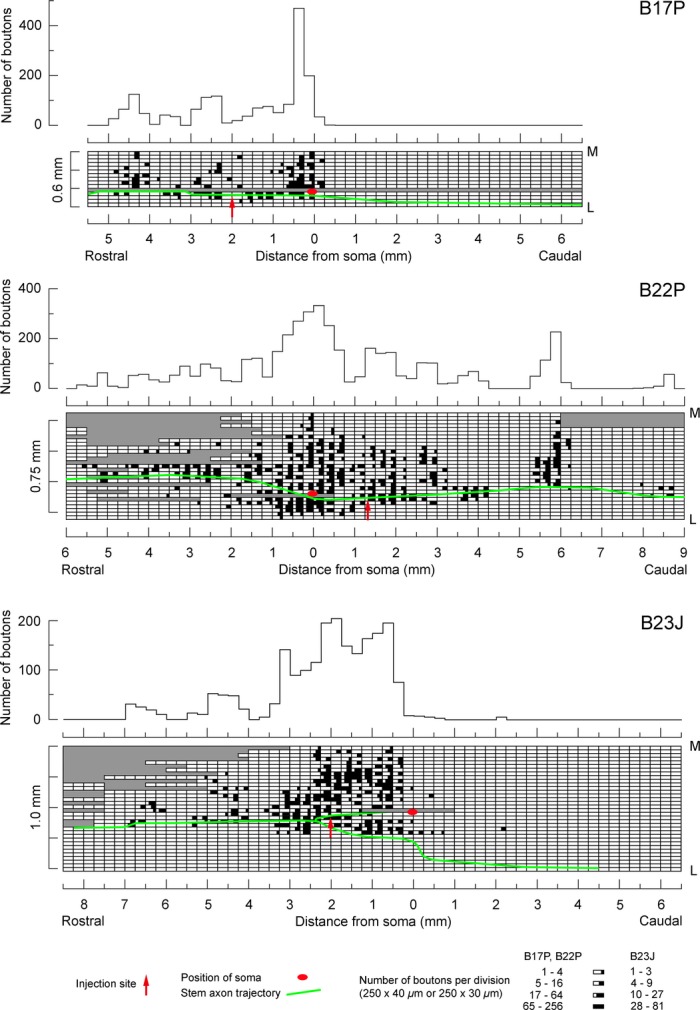
Figure 4.

Bouton distributions for Renshaw cells. The three cells sectioned in the parasagittal plane are illustrated. For each cell, the upper plot shows the rostrocaudal distribution of boutons and the lower plot shows the bouton counts for individual sections, indicating also the mediolateral distribution (M, medial; L, lateral). Note the different section thickness for the first example compared to the other two and the nonlinear scales for the “number of boutons” in the lower plots. Positions of the soma, the stem axon and the injection site are as indicated. Note that the medial location of some of the boutons, particularly in B, means that these must also be located quite dorsally because of the dorsomedial orientation of the medial border of the ventral horn. Gray areas represent missing or unusable areas of individual sections.
