Figure 5.

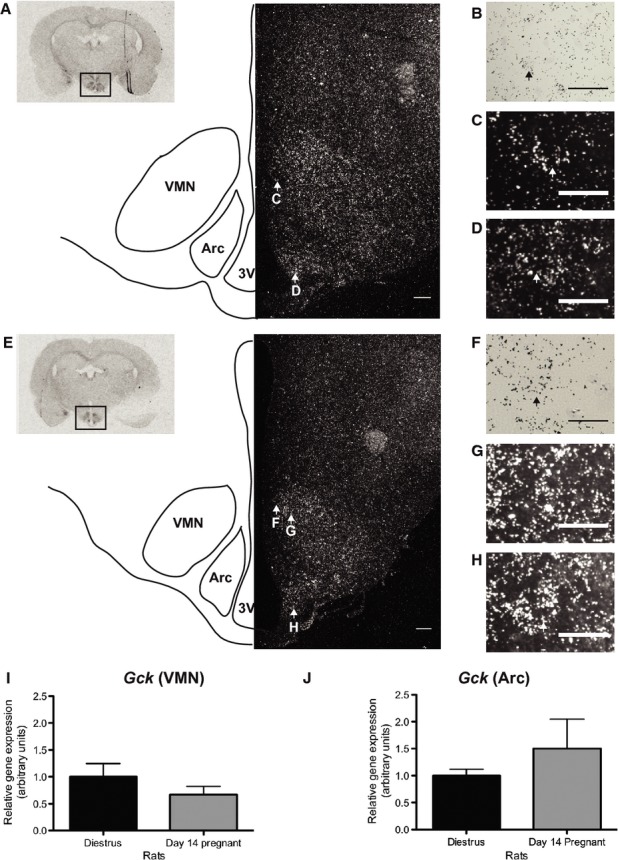
Glucokinase mRNA expression in the rat medial basal hypothalamus. (A) Composite diagram containing an insert (top left corner) depicting an autoradiographic image showing positive hybridization for glucokinase mRNA in the hypothalamus of a nonpregnant rat. The boxed area is shown in a larger form below as a combination of a line diagrammatic representation and dark-field image. The line diagram depicts the approximate locations of the VMN and arcuate nucleus (Arc) in the dark-field image. Low positive expression for glucokinase mRNA is present in both the Arc and VMN. (B) High-powered bright-field image of the VMN. An example of a glucokinase-positive cell is indicated by the black arrow. (C and D) High-powered dark-field images of glucokinase-positive cells (indicated by white arrows) in the VMN and Arc, respectively. The corresponding cells are indicated by white arrows in A. (E) The same type of composite diagram as in A but from a day 14 pregnant rat. A low positive signal for glucokinase mRNA is detectable in both the Arc and VMN as shown in the dark-field image. (F) High-powered bright-field image showing an example of glucokinase mRNA positive cells (indicated by black arrow) in the VMN. (G and H) Dark-field examples of glucokinase mRNA positive cells (indicated by white arrows) in the VMN and Arc, respectively. The location of these corresponding cells are indicated by white arrows in E. 3V indicates the third ventricle. Scale bars A and E 200 μm, B and F 20 μm, C, D, G, H 25 μm. Graphs I and J show relative levels of Glucokinase mRNA expression in laser capture microdissected VMN (I) and arcuate (J) nucleus samples obtained from nonpregnant (n = 6) and day 14 pregnant (n = 6) rats. Data in I and J presented as relative gene expression with comparison to control group ± SEM. VMN, ventromedial nucleus of the hypothalamus.
