
Figure 4.
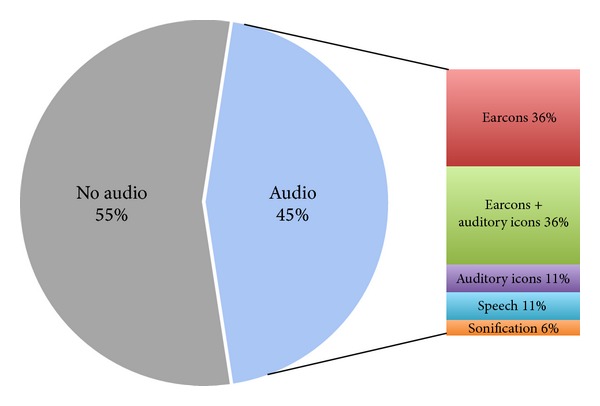
Pie chart representing the distribution of auditory feedback techniques for all the 42 reviewed systems.
Official websites use .gov
A
.gov website belongs to an official
government organization in the United States.
Secure .gov websites use HTTPS
A lock (
) or https:// means you've safely
connected to the .gov website. Share sensitive
information only on official, secure websites.
Pie chart representing the distribution of auditory feedback techniques for all the 42 reviewed systems.