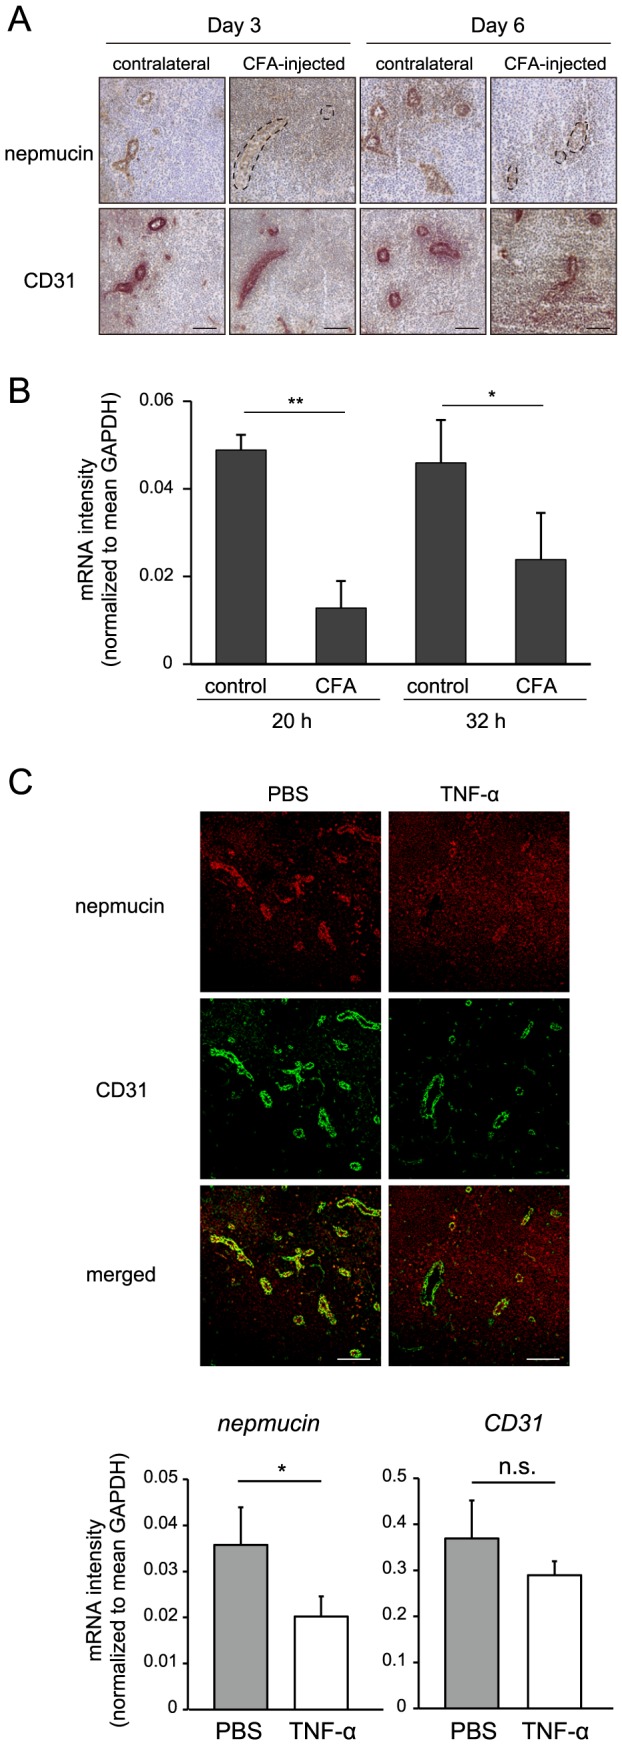
Figure 6. Nepmucin/CD300LG expression is down-regulated by inflammatory signals.

(A, B) Draining LNs and contralateral LNs were harvested at the indicated time points after CFA was subcutaneously injected into the right footpad. In (A), the expressions of nepmucin and CD31 were analyzed by immunofluorescence staining. In (B), the nepmucin mRNA expression was assessed by quantitative PCR using primers that specifically recognize nepmucin gene. Data represent the mean ± SD (n = 3 per group) from three independent experiments. In (C), the nepmucin and CD31 expressions were examined by immunofluorescence staining (upper panel) and quantitative PCR (lower panel) of the draining LNs two days after the footpad injection of TNF-α (200 ng) or PBS. Data show representative images, n = 3-4 mice per group. *p<0.5, **p<0.01, ***p<0.005, n.s., not significant. Scale bars, 100 µm.
