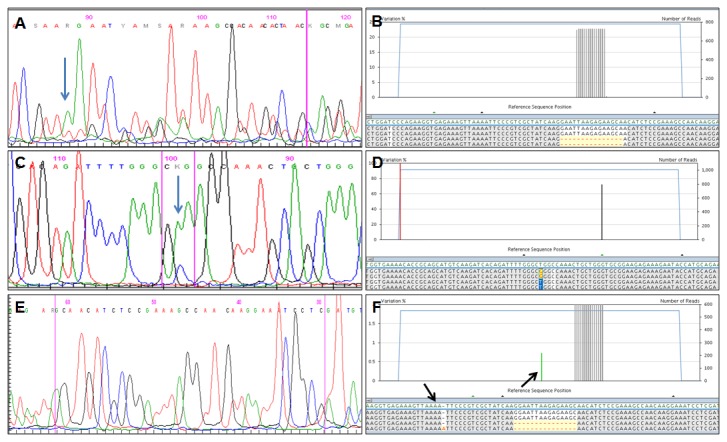
Figure 4. Results of sequencing analysis of EGFR gene after Sanger (A-C-E) and Next Generation (B-D-F) sequencing.

A-B) an exon 19 deletion detected by both Sanger (A) and NGS (B); the percentage of mutated alleles identified by NGS was >20%. C-D) the L858R detected by both Sanger (C) and NGS (D); the percentage of mutated alleles identified by NGS was >20%. E-F) an exon 19 deletion detected by NGS (F) but not by the Sanger method (E); the percentage of mutated alleles identified by NGS was <20%.
Blue arrows in A and in C indicate the starting nucleotide of deletion and the mutated nucleotide, respectively; black arrows in F indicate homopolymer stretches (e.g. four adenines).
