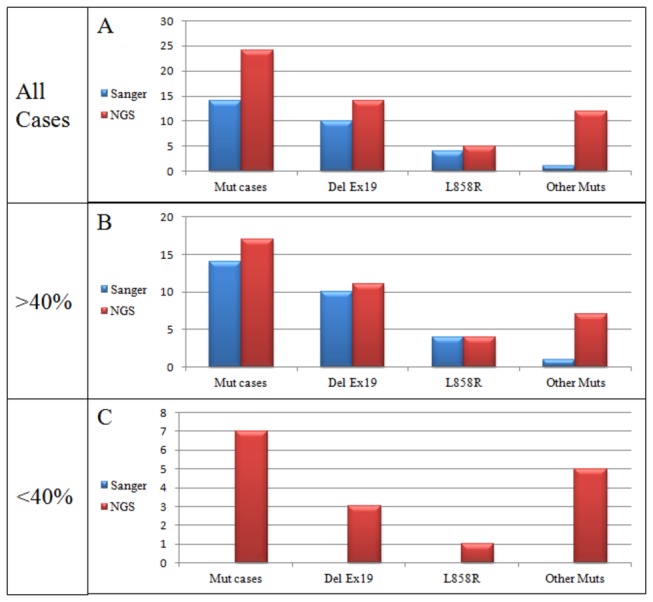
Figure 5. Schematic illustrating mutations detected by Sanger and Next Generation sequencing versus the proportion of neoplastic cells in the sample.

NGS, Next Generation Sequencing; Mut cases, cases with any mutation; Del Ex19, deletion in exon 19; Other muts, mutations other than exon 19 deletion or L858R.
