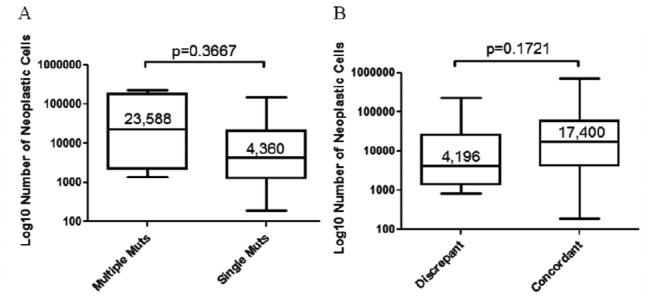
Figure 6. Tumor cell number in cases with multiple vs.

single EGFR mutation (A) and in cases where NGS identified mutations not seen after Sanger sequencing (discrepant cases) (B).
Numbers refer to the median number of neoplastic cells in the sample; bars indicate the smallest and highest number of neoplastic cells; the p-value was obtained with the student T test.
