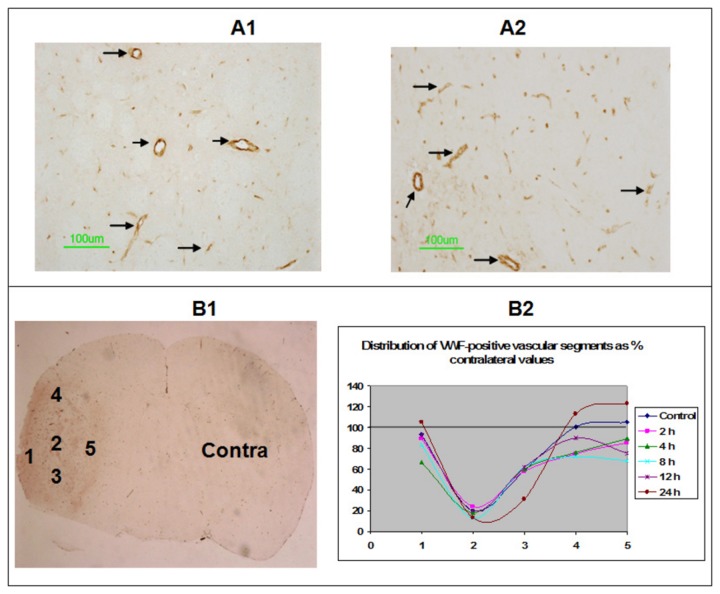
Figure 4. vWF-positive vascular segments, their visualization and quantification.
Images from the contralateral hemisphere (A1) and a tumor periphery (A2) are shown at 20X magnification to exemplify the staining. The stained vasculature is indicated by arrows. Scale bar = 100 μm. Some examples of ROIs of interest 1-5 spanning the tumor along with the contralateral ROI (Contra) from a low magnification vWF stained coronal section are shown in B1. Distribution of the mean number of stained segments from each ROI expressed as % of the contralateral value is shown 4B. The numbers on abscissa indicate the ROI (shown in 4B) from which the measurements were made. The ordinate is the % contralateral value. Treatments regimens are color-coded in the graph. The values from the various treatments were not significantly different from untreated controls (Blue). Black solid line represents the 100% value from contralateral hemisphere.

