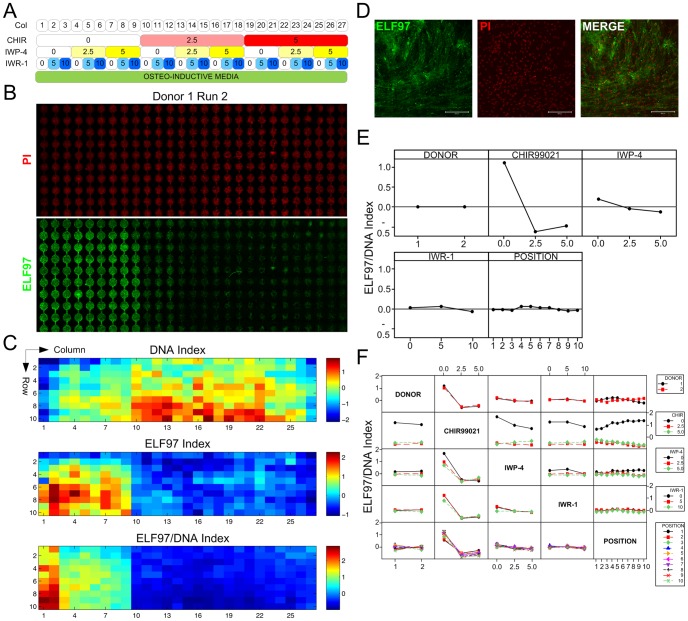
Figure 2. MBA screening of Wnt modulators in MPC osteogenesis.
A Panel of screening conditions in MBAs. Numbers denote concentrations of the various molecules, in µM. B Confocal microscopy images of endpoint PI (DNA) and ELF97 (alkaline phosphatase activity) staining from a representative experiment. Direction of fluid flow was from top to bottom. C Heatmaps of expression indices (see Methods) for DNA, ELF97, and ELF97/DNA ratio. The average expression index of 2 runs from each of 2 MPC donors (4 in total) is shown, and units represent global standard deviations of difference relative to the global mean. For data from individual runs, see Figs. S2–S5. D Higher magnification fluorescence images of representative MPCs in MBA displaying alkaline phosphatase activity (ELF97) and DNA staining (PI). Scale bar: 200 µm. E Main effects plot showing effect of DONOR, CHIR99021 (CHIR), IWP-4, IWR-1 and POSITION on expression index for ELF97/DNA ratio. F Interaction effects plot showing effects of 2 combined factors on ELF97/DNA ratio.

