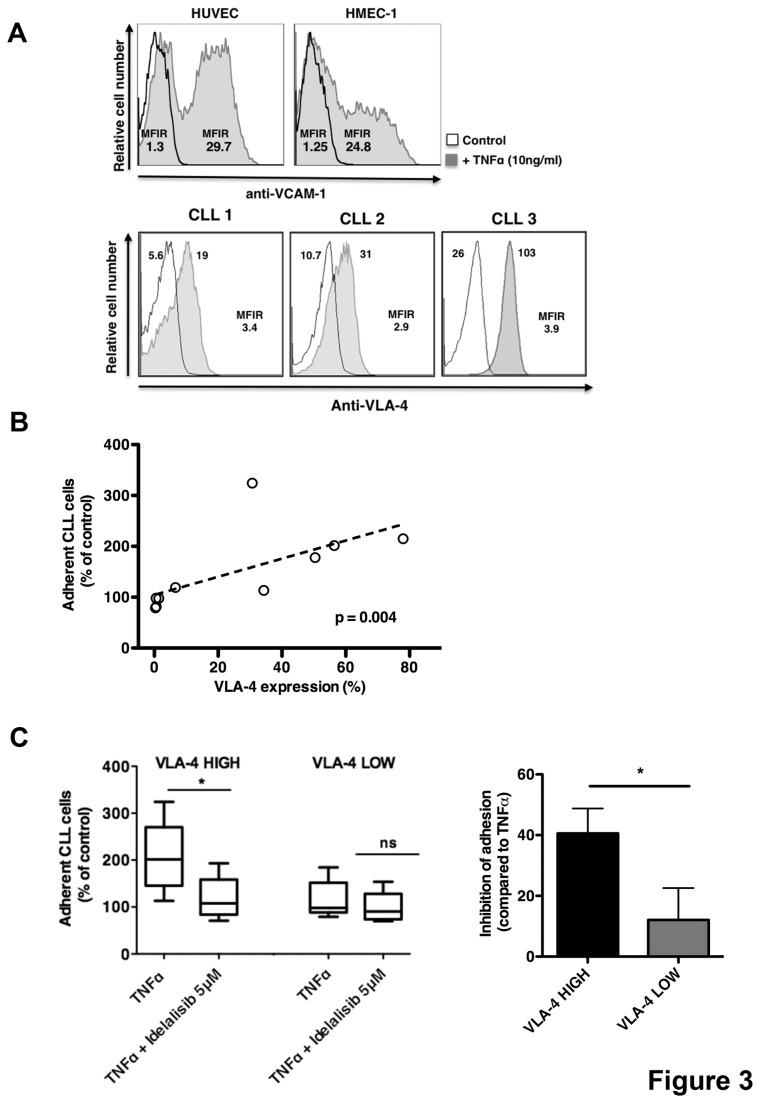
Figure 3. Idelalisib affects adhesion mediated by VLA-4 and VCAM-1 interaction.
(A) On the left, displayed are fluorescence histograms depicting the relative fluorescence intensity of HUVEC and HMEC-1 stained with anti-VCAM-1 mAb either treated or not treated (control) with TNFα (10ng/ml) for 24 hours. Mean fluorescence intensity ratio was calculated by dividing the mean fluorescence intensity for VCAM-1 by the mean fluorescence of the isotype control in both conditions. On the right, representative fluorescence histograms of CLL cells stained with anti-VLA-4 (grey histograms) or the corresponding isotype control (white histograms). THE MFIR is displayed below the histograms. (B) A positive correlation is displayed between VLA-4 expression (%) and the relative adhesion of CLL cells to HUVEC stimulated with TNFα (n=10). (C) The box plot displays a comparison of CLL cell adhesion to HUVEC TNFα-stimulated in presence or absence of idelalisib in VLA-4 high (n=5) and VLA-4 low (n=5) expression groups. Bar diagram represents the percentage of inhibition in CLL adhesion to HUVEC stimulated with TNFα induced by idelalisib in VLA-4 high and VLA-4 low CLL samples relative to adhesion observed without idelalisib. Data are shown as mean ±SEM (*p<0.05).

