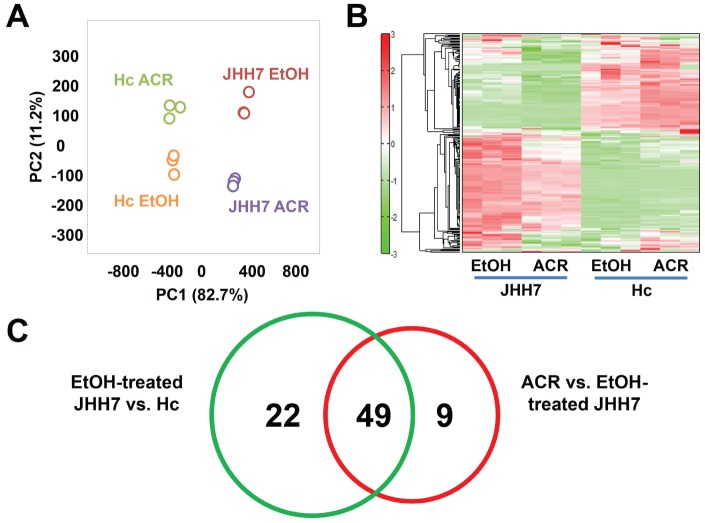
Figure 2. A comparison of the metabolic profile of EtOH- or ACR-treated JHH7 and Hc cells determined by CE-TOFMS.
PCA scoreplot (A) and heat map (B) from metabolic data of JHH7 and Hc cells treated with EtOH and ACR (n = 3). Venn-diagrams (C) showing the number of metabolites that were significantly deregulated between the two groups.

