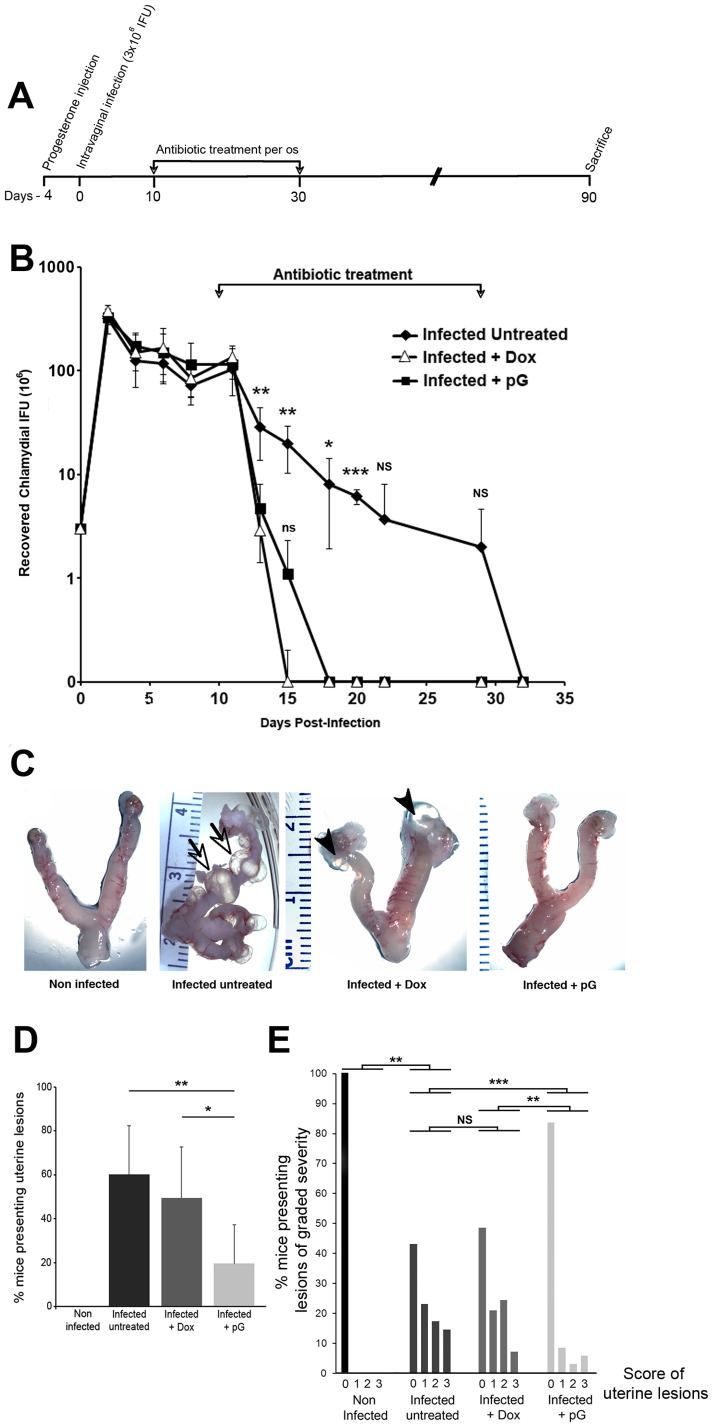
Figure 6. pG oral treatment prevents the development of uterine lesions in C57Bl/6 mice previously infected with C. muridarum.
A- Female mice were synchronized in their cycle by a Progesterone injection and four days later, were infected intravaginally with 3×10⁶ IFUs of C. muridarum. After 10 days, animals were treated or not with 10 mg/mL of doxycycline or penicillin G for an additional 20 days. Mice were sacrificed at 90 days post infection. B- Infection course in infected mice either left untreated (black diamond), or treated per os with Dox (white triangle) or with pG (black square). Each data point represents the mean ± standard deviation of the number of inclusion forming units recovered from vaginal swabs collected from at least 5 mice per group. *: p< 0.05 compared to pG- and Dox-groups, **: p< 0.01 compared to pG- and Dox-groups, ***: p< 0.001 compared to pG- and Dox-groups. NS: non-significant compared to pG- and Dox-groups. ns: non-significant compared to Dox-group. C- Mice were infected with C. muridarum and treated as described in Figure 6A. Ninety days after infection, mice were sacrificed to collect and examine their entire genital tract. The pictures are representative of the cohorts studied. The presence of cysts is indicated by arrows, and hydrosalpinges by arrowheads. D- After sacrifice of the mice, the genital tract was isolated and the percentage of mice presenting uterine lesion in at least one horn was determined. Non-infected group (n = 10), infected non-treated group (n = 35), infected + Dox group (n = 29), infected + pG group (n = 36). * correspond to p< 0.05, ** correspond to p <0.01. E- After sacrifice, the severity of uterine lesion (cysts and hydrosalpinges) was scored as described in material and methods. The number of uterine horns without (0) or with varying degrees (1 to 3) of lesion severity was reported. The Mann Whitney test was used to compare the differences in lesion severity score between the different groups of mice, as indicated in the figure. NS: non-significant; ** correspond to p< 0.01; *** correspond to p< 0.001.

