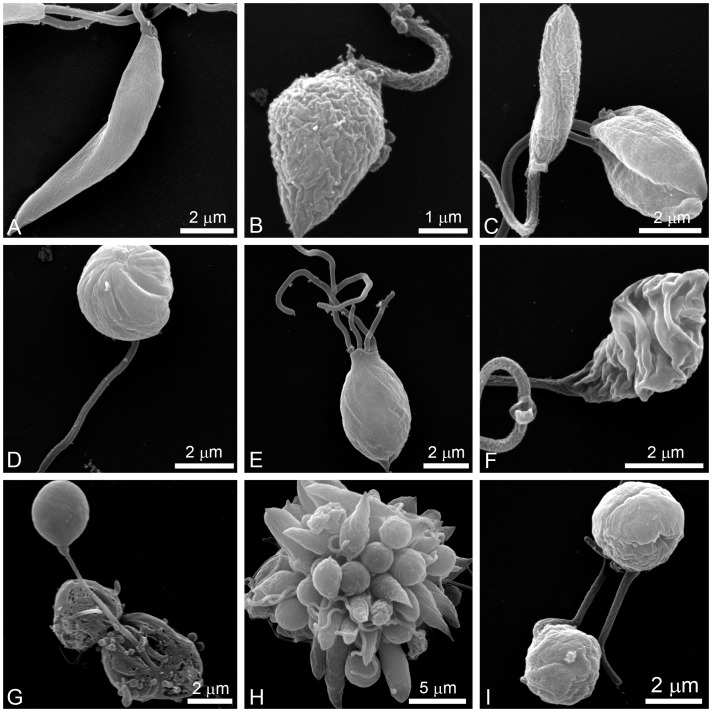
Figure 3. Scanning electron microscopy (SEM) of L. amazonensis promastigotes.
Control parasites (A) and promastigotes that were treated with different concentrations of POSA and ITZ for 48 h (B–I) were observed by SEM. (B, C) 1 µM ITZ; (D–F) 1 µM POSA; (G) 5 µM ITZ; (H, I) 5 µM POSA. The images show dramatic alterations in promastigote shape (B–I), a promastigote with four flagella (E), and profound changes in the plasma membrane (B, C, F).

