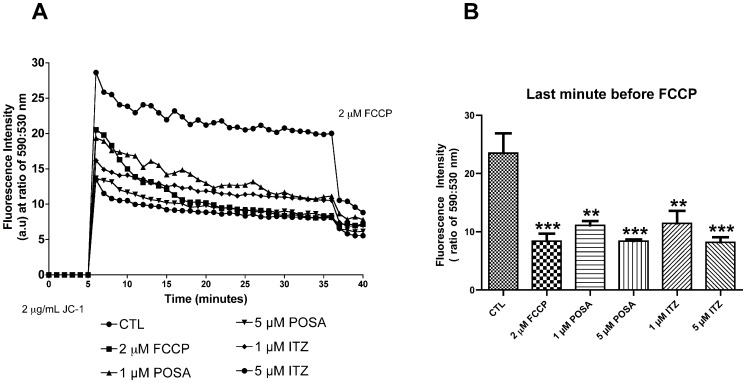
Figure 6. Evaluation of mitochondrial transmembrane electric potential (ΔΨm) in L. amazonensis promastigotes using the JC-1 fluorochrome.
(A) Values of ΔΨm were evaluated over 36 min, before the addition of 2 µM FCCP to abolish the mitochondrial potential. Two concentrations of POSA and ITZ were used (1 and 5 µM) for 48 h of treatment. The ΔΨm values are expressed as the ratio of the reading at 590 nm (aggregate) to the reading at 530 nm (monomer). (B) Analysis of ΔΨm at the last minute before the addition of 2 µM FCCP. The data suggest that similar alterations in ΔΨm are induced by POSA, ITZ, and FCCP. The experiments were performed three times, each time in triplicate, and the figures shown are representative of these experiments. **p<0.05; ***p<0.0001.

