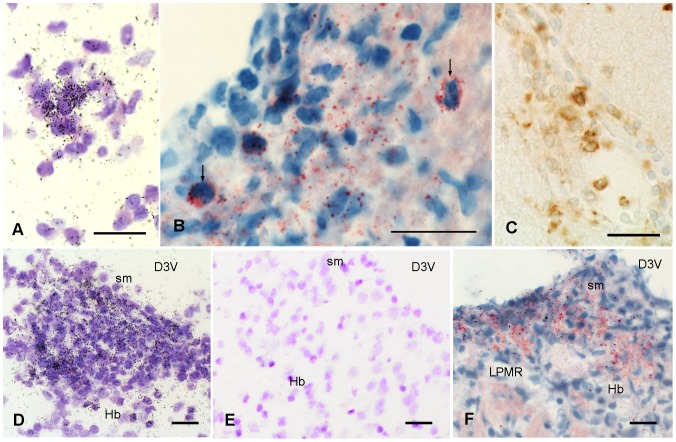
Figure 4. IL-1β expression, CD68 immunoreactivity and Oil-Red O staining.
Expression of mRNA for IL-1β, presence of activated macrophages/microglial cells, and lipid fragmentation. All pictures were taken from animals at the first phase of cr-EAE. (A) IL-1β mRNA in cerebellar lobule. (B) Oil-Red O in cerebellar lobule. Arrows indicate lipid laden cells. (C) CD68 in cerebellar lobule. (D) IL-1β mRNA in the habenula. (E) Absence of IL-1β mRNA in the habenula of a control animal (F) Oil-Red O in the habenula. Sections are counterstained with Cresyl Violet (A, D) or with Mayer's hematoxylin (B, E, F) D3V: dorsal third ventricle, Hb habenula nuclei, LPMR: lateral posterior thalamic nucleus, sm: stria medullaris. Scale bars = 20 µm.

