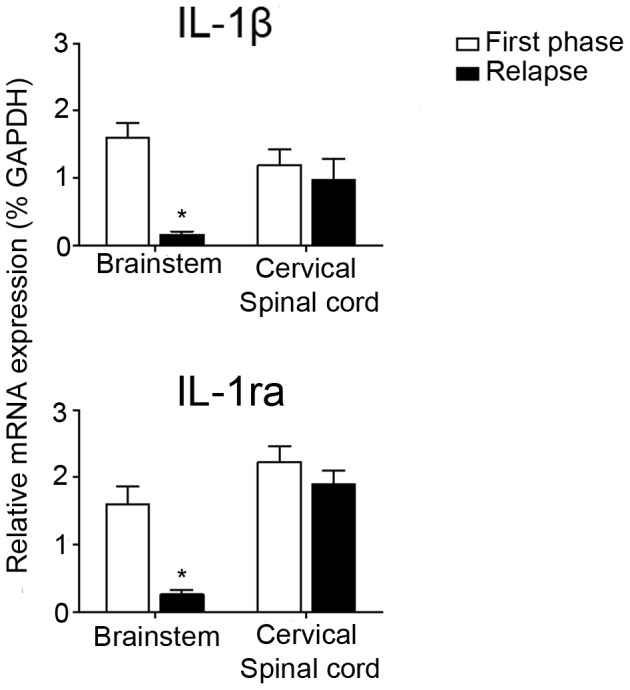
Figure 9. Semi-quantitative RT-PCR analysis of IL-1β and IL-1ra mRNA.

Q-PCR of IL-1β and IL-1ra mRNA in brainstem and spinal cord during the first phase and relapse of cr-EAE. Data represent mean ± S.E.M. (n = 4) and are expressed relative to GAPDH mRNA. *P<0.05 vs first phase.
