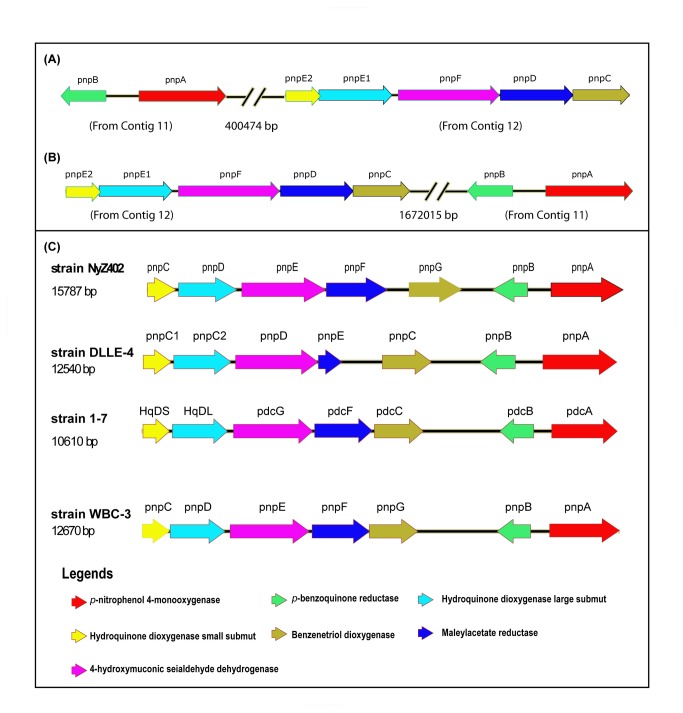
Figure 2. Comparison of p-nitrophenol (PNP) degradation gene clusters from different bacterial strains, schematic representation of the ORFs and distance between the gene clusters when arranged together as shown in pnpAB and pnpCDE1E2F .
(A) schematic representation of distance between Contig 11 (NZ_AJHK02000011.1) and contigs 12 (NZ_AJHK02000012.1) (B) if contigs 12 and then contigs 11 placed in series together then distance between the gene clusters and (C) PNP degradation gene clusters found in the other PNP degrading bacteria Pseudomonas sp. NyZ402 (GU123925.1), Pseudomonas putida DLLE-4 (FJ376608), Pseudomonas sp. 1-7 (FJ821777) and Pseudomonas sp. WBC-3 (EF577044).
Similar genes have been assigned by the same colors.

