
Figure 5. Time course analysis of PNP transformation by purified His-6-PnpA.
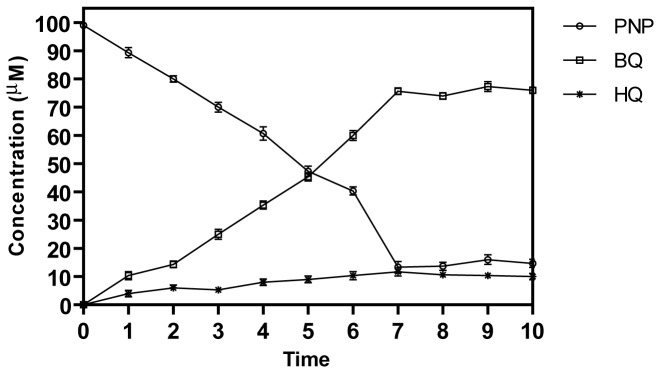
The samples were collected at different time points and analyzed for the formation of BQ and HQ by HPLC analysis. Standard deviation values were calculated by taking the mean of triplicate experiments.