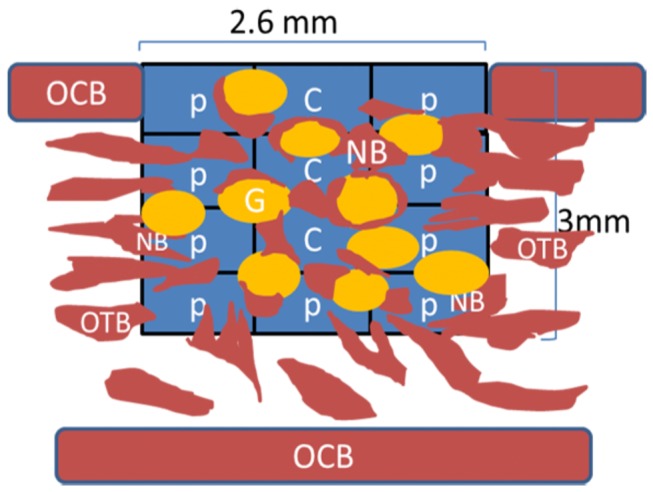
Figure 1. Schematic diagram showing the area of measurements (histomorphometry).

A software rectangular grid consisting of twelve zones covers and determines the entire area of the treated defect. C = Central region; P = Peripheral region; OCB = Original cortical bone; OTB = Original trabecular bone; NB = new bone; G = Granule.
