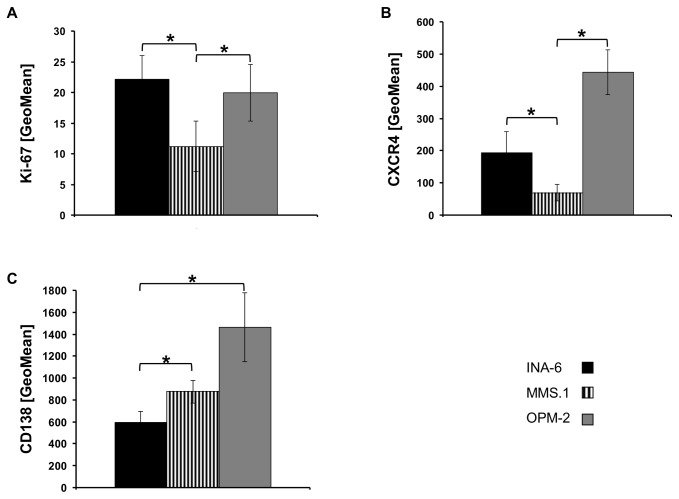
Figure 1. Hallmarks of MM-biology in MM-cell lines.
(A) Proliferation rate. Cells were stained with anti-hKi67 FITC antibody and geometric mean fluorescent intensity (GeoMean) was quantified by FACS. All samples were analyzed in duplicates and background corrected (n=4). Cell surface expression of CXCR4 (B) and CD138+ (C) was analyzed by FACS. Cells were stained with an anti- hCXCR4-PE or anti- hCD138-APC antibody in duplicate, background-corrected and GeoMean was quantified (n=5). Columns represent mean values and error bars the standard deviation. Asterisk indicate statistically significant differences (p <0.05).

