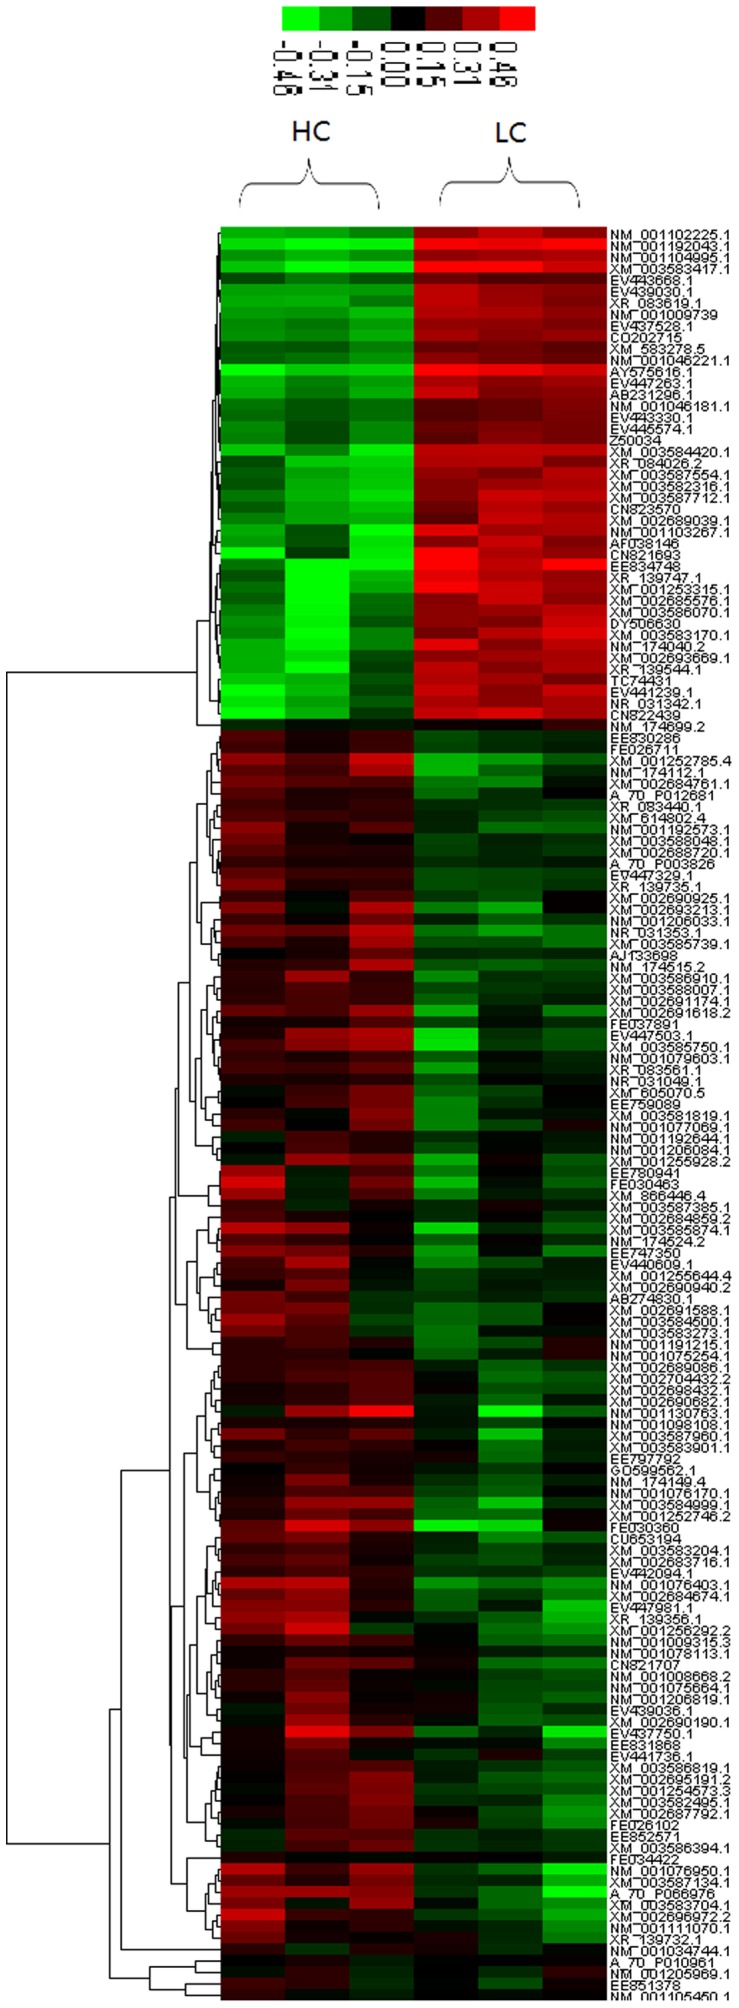
Figure 3. Hierarchical cluster analysis of the differentially expressed transcripts (n = 155).

155 transcripts were differentially expressed (adjusted p<0.01). Red and green colors reflect the high and low intensities, respectively.

155 transcripts were differentially expressed (adjusted p<0.01). Red and green colors reflect the high and low intensities, respectively.