Fig. 7.
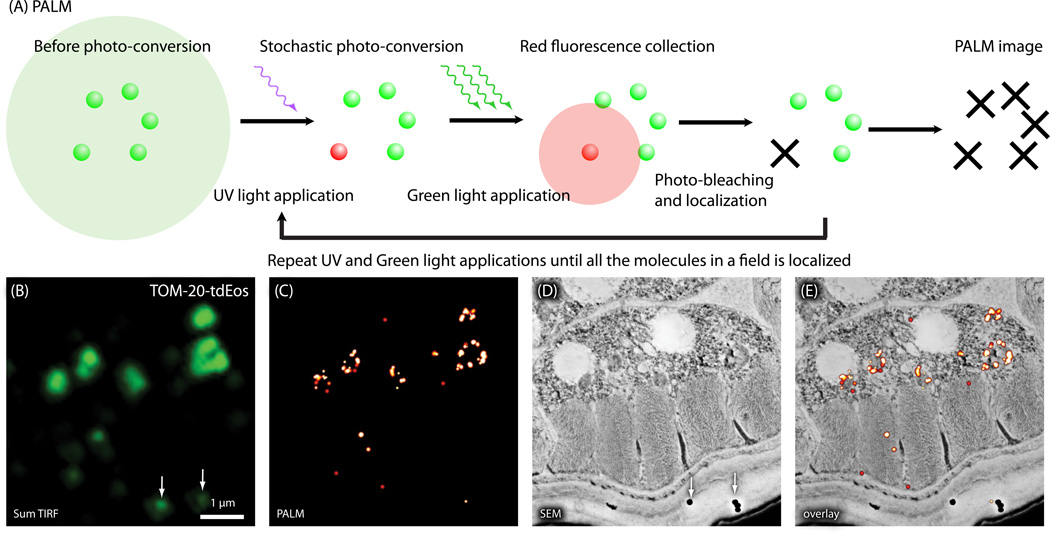
Nano-fEM using photo-activation localization microscopy (PALM). (A) Schematic diagram showing the concept of PALM. Molecules are activated stochastically, imaged, and photo-bleached. The centroid of each fluorescence spot is then calculated and reconstructed in a final image. (B) Sum TIRF image of TOM-20-tdEos acquired from a thin section (80 nm) of a GMA-embedded sample. White arrow indicates fluorescence emitted from gold particles. (C) Corresponding PALM image of TOM-20-tdEos. (D) Electron micrograph of a body muscle acquired from the same section. (E) Nano-fEM of TOM-20-tdEos. The fluorescent signals are localized to the outer membrane of the mitochondria.

