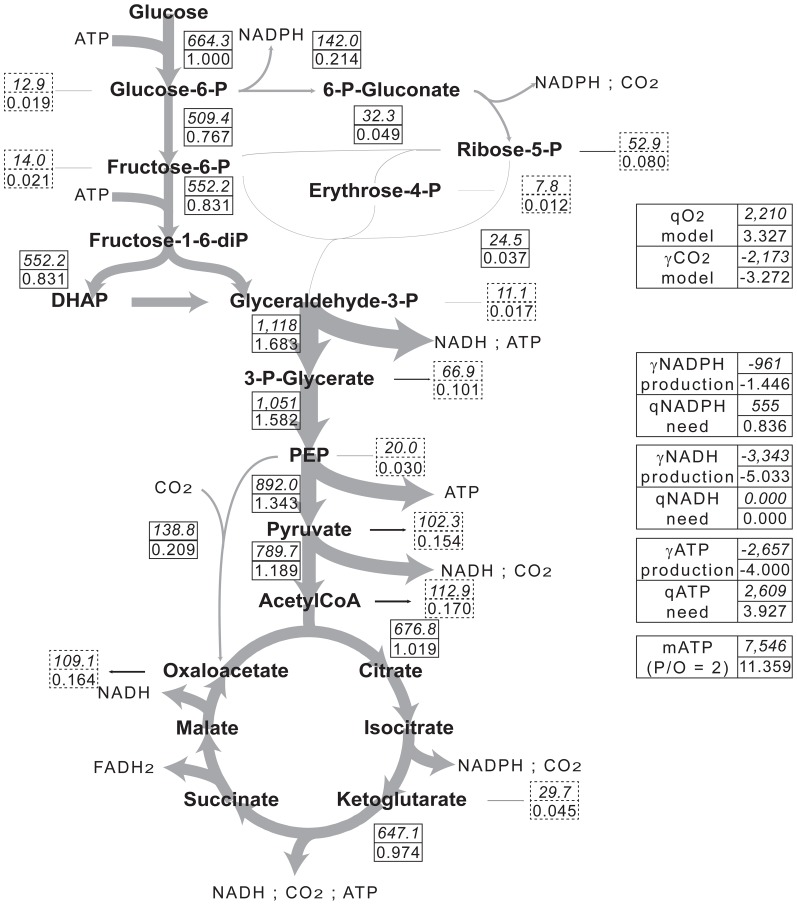
Figure 1. Carbon flux distribution in S. coelicolor M145.
Grey arrows represent carbon fluxes within the central metabolism of S. coelicolor M145. Arrow widths are proportional to carbon fluxes. Flux values in the central metabolism are included in boxes with solid lines, flux values to biomass are included in boxes with dotted lines. The upper numbers represent average actual fluxes (μmol (g dry mass)−1 h−1), the lower number represent average normalized fluxes (μmol (μmol glucose)−1). Positive values correspond to consumption and negative values to production.

