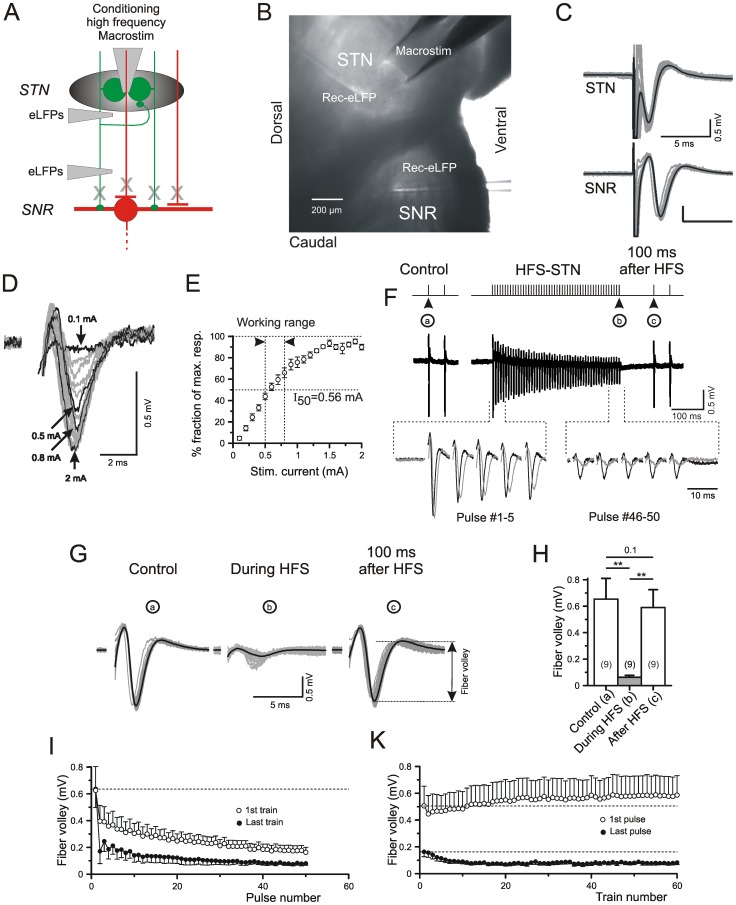
Figure 1. Local field potentials in the SNr after low and high frequency stimulation of the STN.
A) Scheme of experiment. B) Image of the slice showing the electrode positions for the experiment illustrated in C. C) Individual (grey) and average (black) traces of FVs in gabazine and DNQX+APV. D) Specimen records of FVs in the SNr at various stimulus intensities. E) Dependency of FV amplitude on stimulus intensities. F) Control response before HFS-STN and single conditioning-test trial. Please note that both the conditioning HFS stimuli and the low frequency test stimuli were delivered through the same bipolar macroelectrode in the STN. (a–c) refer to pulses inducing the FV shown in (G). The traces in the bottom of (F) correspond to the first and the last 5 stimuli within an HFS train. In this case traces in black represent responses during the first HFS train, traces in gray - responses during the last HFS train in a series of 60 HFS trials. G) Individual (gray) and averaged (black) FVs recorded before, during and after HFS-STN, as indicated in (F). H) Quantification of results from 9 slices/9 mice. I,K) Dynamics of FV amplitude within one HFS-STN train (I) and during train repetitions at a rate of 6/s (K). Note that the 1st response in each train recovers fully (I) or even displays slight potentiation with train repetition (K) while the last responses only exhibit depression.

