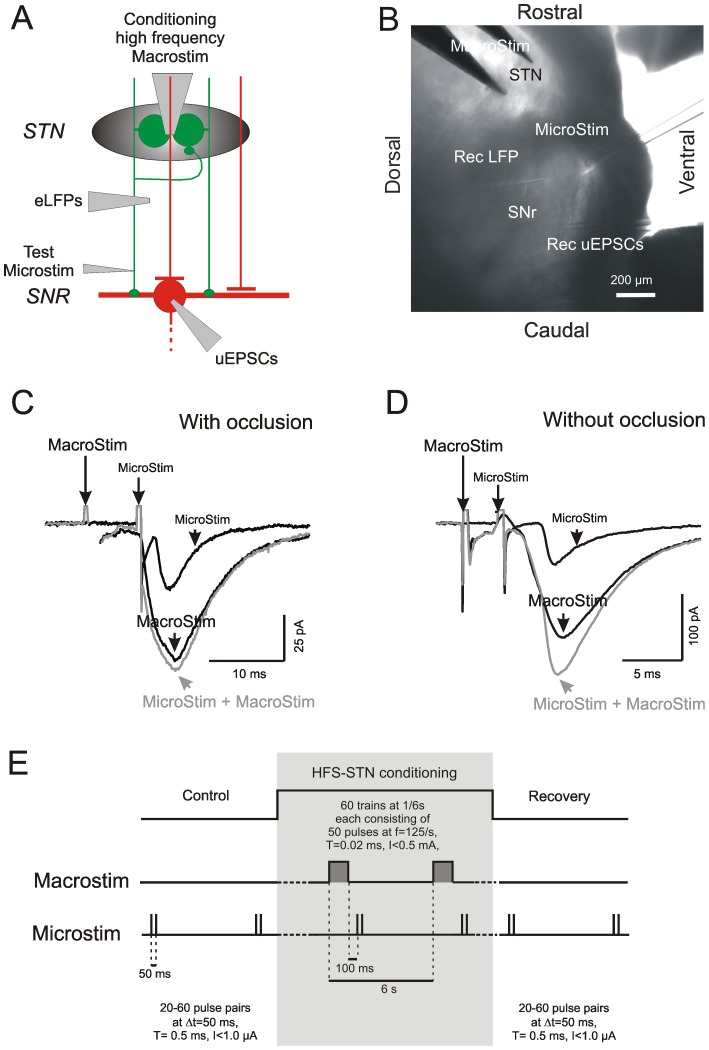
Figure 2. Scheme of occlusion test and conditioning experiment.
A) Experimental arrangement showing the involved cellular elements, their connections and sites of stimulation/recording. Green: glutamatergic elements. Red: GABAergic elements. “MacroStim” - bipolar platinum iridium macroelectrode for multi-unit STN activation. “Microstim” - glass pipettes for activation if single axons. B) Image of a sagittal slice comprising the STN and the SNr. Note tip positions of the stimulating and recording pipettes. C,D) Occlusion test to determine whether the unit selected for Microstim belonged to the axonal pool activated by Macrostim. Full algebraic summation of the compound response to Macrostim and the unitary response to Microstim indicates that there is no continuity of the test fiber into the STN (C). Accordingly, full summation is taken as evidence that the fiber selected for Microstim was not occlusion-positive into the STN (D). E) Pulse patterns during conditioning Macrostim in the STN and test Microstim of a single STN fiber in the SNr. Each experimental session consisted of three parts: Control – a pair Microstim pulses at an interstimulus interval of 50 ms, HFS-STN – combination of HFS Macrostim trains followed at an interval of 100 ms by a pair of Microstim pulses, and Recovery – same as control. The repetition rate of the trials was 1/6 s.

