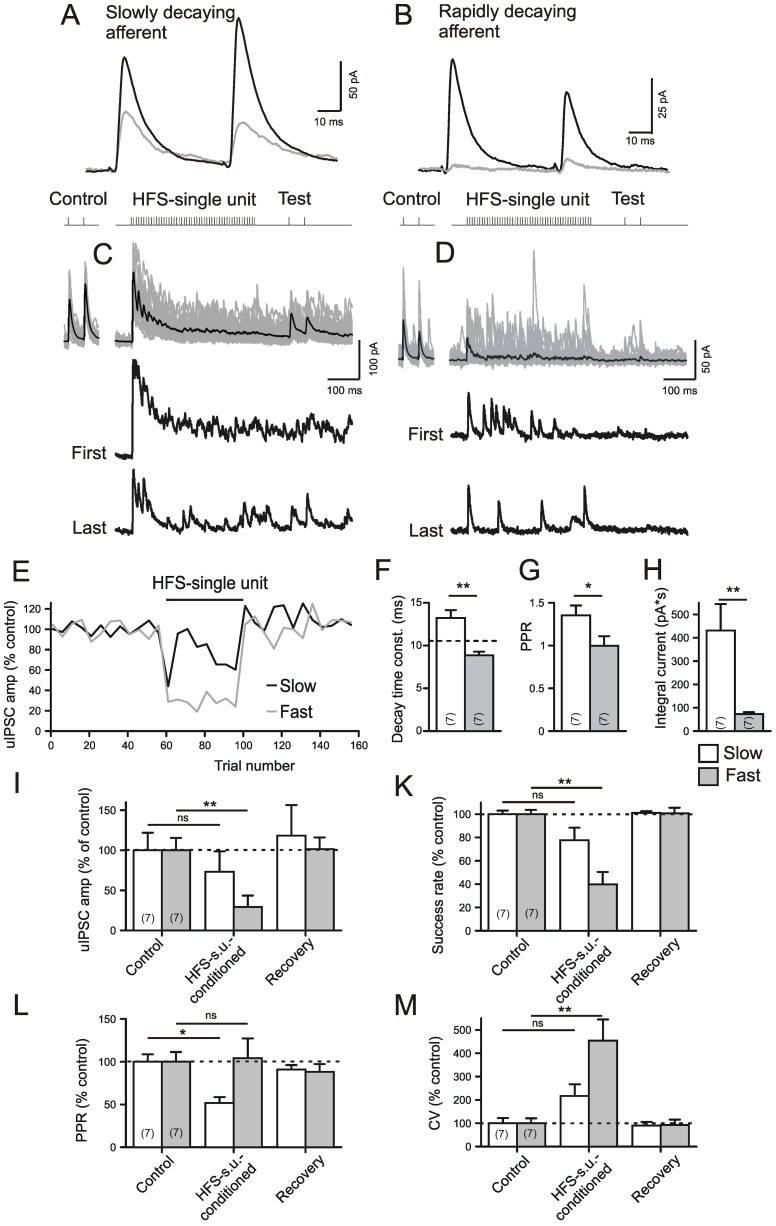
Figure 6. Two types of unitary IPSCs and their responses to single-unit HFS.
A) Experiment in the presence of DNQX (10 µM) and APV (50 µM). Holding voltage −50 mV, chloride equilibrium potential −100 mV. A,B) Traces of averaged uIPSCs belonging to the more rapidly decaying type with paired pulse facilitation (A) and to the more slowly decaying type with paired pulse depression (B). Black trace: Control, Grey trace: HFS-conditioned. C, D) Single-unit HFS experiment. Traces belong to the same experiment as (A,B), respectively. Note larger integral current in C). E) Plot of normalized uIPSC amplitudes in response to the first test pulse following after HFS. Note persistence of current responses from afferents with slowly decaying uIPSCs. F–H) Characteristics of uIPSCs. Note differences in the time constant of decay (F), paired pulse ratio (G) and the integral current during HFS (H). The broken line in (F) denotes separation threshold. I–M) Quantification of results from HFS-conditioning. The differences between Control and respective Recovery values were not significant and are omitted in the graphs, for clarity.

