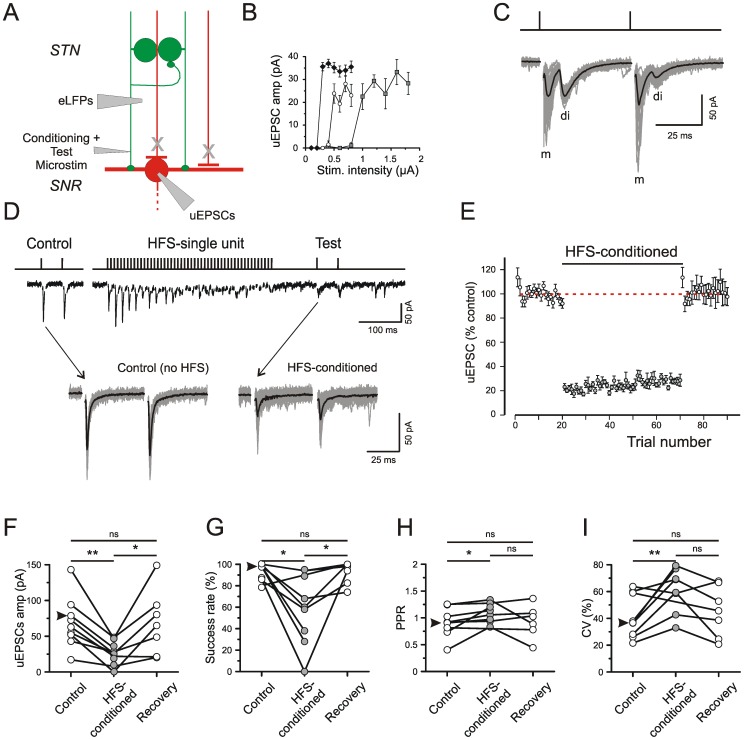
Figure 7. Dynamics of unitary EPSCs during single-unit HFS.
A) Scheme of experiment. Note that in these experiments conditioning HFS and test pulse were applied to the same Microstim site. All recordings were performed in the presence of 15 µM gabazine. B) Estimation of threshold intensity for three single afferents to SNr neurons. C) Specimen records of responses to Microstim of a single STN fiber in the SNr. Note presence of monosynaptic (m) and disynaptic (di) uEPSCs. D) Single trial with traces with HFS and superposition of Control and HFS-conditioned traces from 20 trials. E) Plot of unitary test responses during Control (without HFS, 20 trials), HFS (50 trials) and Recovery (20 trials). Average and SE from 7 cells. F–I) Quantification of results. Arrow head denotes data from experiment illustrated in D.

