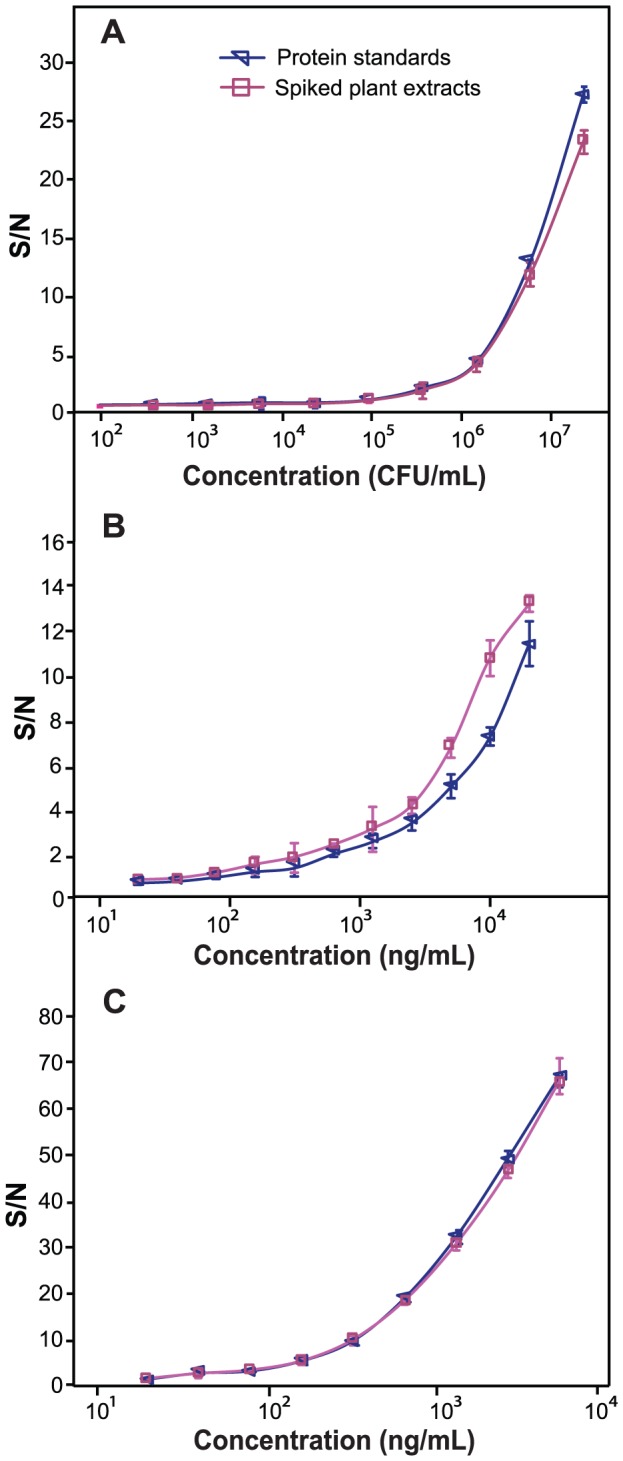
Figure 6. Sensitivity determination of the microfluidic platform.

Comparison of assay dynamic range for Ac (A), WSMoV (B), and MYSV (C) detection between protein standards and spiked plant extracts (n = 3) by the microfluidic platform. Error bars indicate ± standard deviations.
