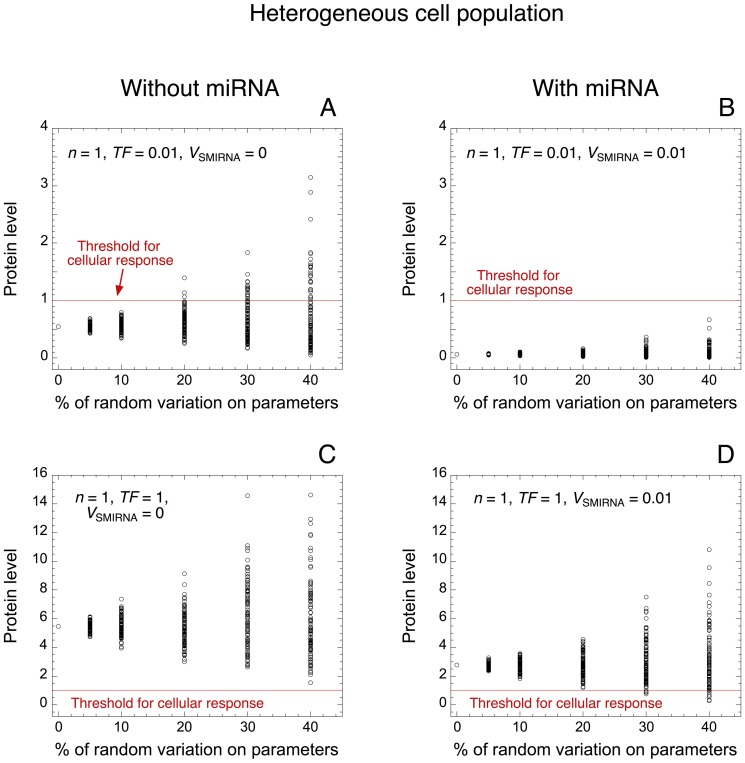
Figure 4. Robustness of protein expression towards random variation of parameter values.
Levels of protein are shown towards the percentage of random variation around the default value for every parameter of the model in the absence (V SMIRNA = 0 in A, C) or presence of miRNA (V SMIRNA = 0.01 in B, D), as well as with low (TF = 0.01 in A, B) or high levels of TF (TF = 1 in C, D). This simulation may represent the dynamics of protein synthesis in a heterogeneous cell population. Red lines indicate the arbitrary threshold of protein needed to ensure a cellular response. With a low level of TF, miRNA robustly inhibits the undesirable expression of protein, even when 40% of random variation is considered on each parameter of the model (compare panels A and B). For each condition, 100 deterministic cells with random variation on each parameter are considered. Each dot corresponds to the protein level of one cell. Default values for the parameter are as in Table 2. For all simulations involving heterogeneous cell population, the parameter variation is applied with a uniform distribution around the mean value for each parameter.

