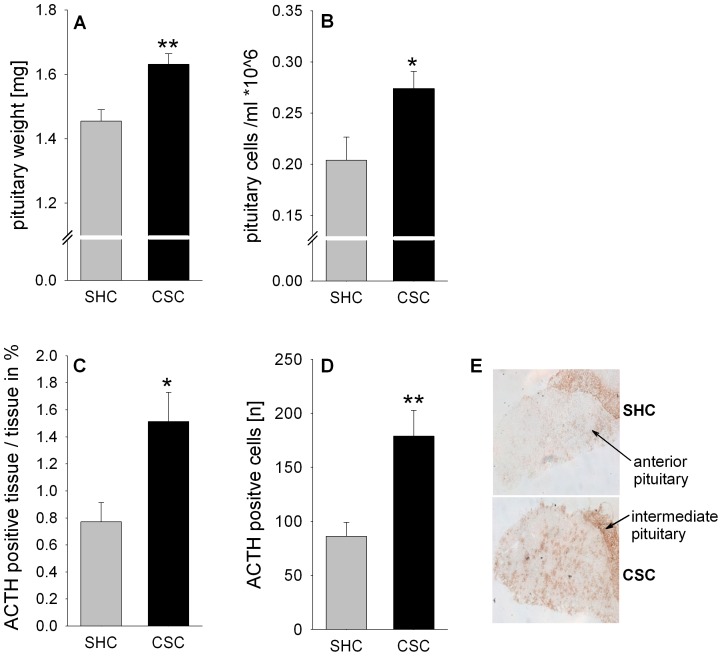
Figure 2. Effects of CSC on pituitary weight, pituitary cell number and the number of ACTH positive cells.
Following decapitation on day 20 of CSC the pituitaries of SHC (n = 42) and CSC (n = 61) mice were removed and absolute pituitary weight [mg] was determined (A). The pituitary cells of one set of SHC (n = 6) and CSC (n = 14) mice were isolated and subsequently quantified (per ml) by means of a Cell Viability Analyzer (B). Pituitaries from another set of SHC (n = 6) and CSC (n = 6) mice were cut on a cryostat and subsequently one series of cry-sections was stained with an antibody against ACTH. Per animal, three to six different sections were analyzed and averaged for the percentage of ACTH positive anterior pituitary tissue in relation to the total anterior pituitary tissue (C). Moreover, the number of ACTH positive pituitary cells [n] was counted in the same three to six digitized images and averaged per animal to provide individual means (D). Grey bars represent SHC, black bars CSC mice. Data represent the mean + SEM. * represent P<0.05, ** represent P<0.01 vs. respective SHC mice. (E) Representative images of cryo-sections stained with antibody against ACTH showing anterior and intermediate pituitary.

