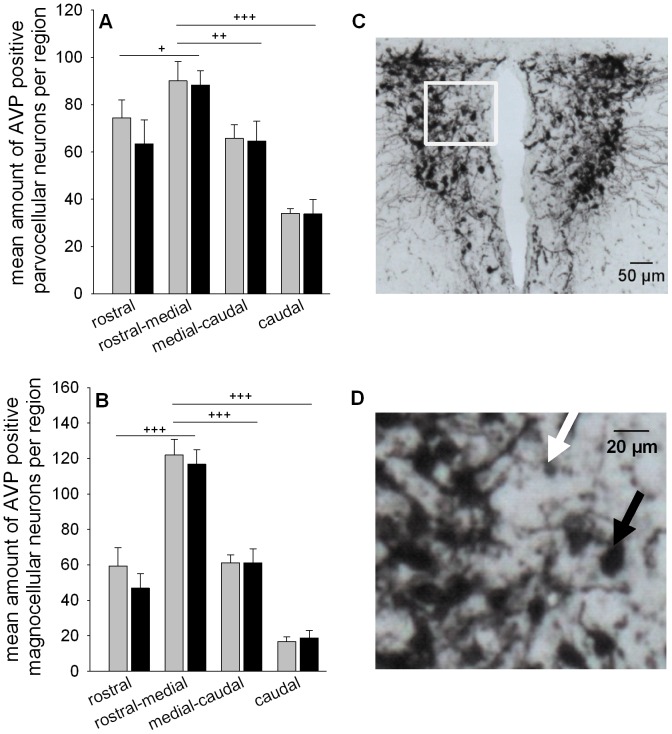
Figure 4. Effects of CSC on the number of AVP positive neurons in the PVN.
Following decapitation on day 20 of CSC brains were removed and immersed in fixative. One series of cryo-sections (5–7 sections per animal), containing the regions rostral, rostral-medial, medial-caudal and caudal was stained for AVP employing a free-floating approach. Number of parvocellular (A) and magnocellular (B) AVP positive neurons were counted within each region (1–2 sections per region) of the PVN and averaged per animal for SHC (n = 8 per region) and CSC (n = 7–8 per region). Grey bars represent SHC, black bars CSC mice. Data represent the mean + SEM. + represent P<0.05, ++ represent P<0.01, +++ represent P<0.001 vs. rostral-medial region. (C) Representative image of cryo-section stained for AVP in the PVN (magnification: 5×; scale bar 50 µm). (D) Higher magnification (400×) of the magnocellular (black arrow) and parvocellular (white arrow) AVP positive neurons depicted in the white frame of Figure 4C (scale bar 20 µm).

