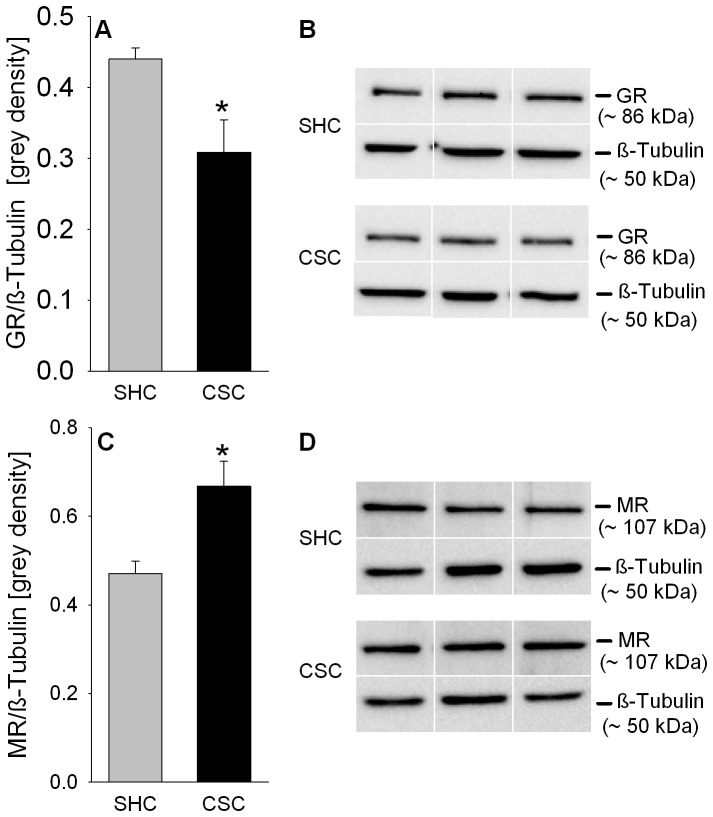
Figure 5. Effects of CSC on relative GR and MR protein expression in the pituitary.
Following decapitation on day 20 pituitaries were removed and protein was extracted from the pituitaries of SHC (GR: n = 11; MR: n = 8) and CSC (GR: n = 10; MR: n = 7) mice for determination of relative GR and MR protein expression [grey density] normalized to the loading control ß-Tubulin (A/C). Grey bars represent SHC, black bars CSC mice. Data represent the mean + SEM. * represents P<0.05 vs. respective SHC mice. Representative images of bands detected for GR (∼86 kDa; B) or MR (∼107 kDa; D) and respective loading control ß-Tubulin (∼50 kDa; B/D) are shown for SHC and CSC mice.

