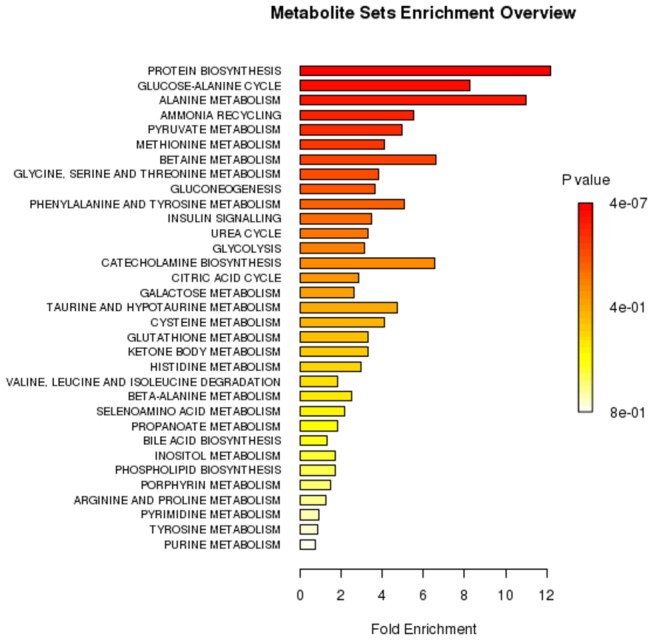
Figure 4. Results of metabolite set enrichment analysis (MSEA).

The horizontal bar graph summarizes metabolic pathways that were strongest affected in the thyroid lesions compared to healthy thyroid.

The horizontal bar graph summarizes metabolic pathways that were strongest affected in the thyroid lesions compared to healthy thyroid.