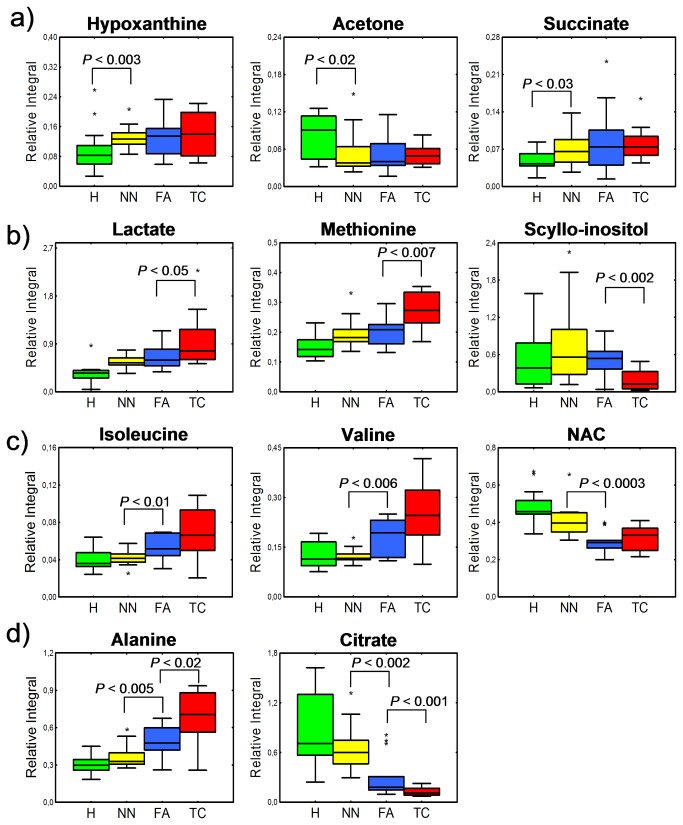
Figure 5. Plots representing relative integral values of selected metabolite.
Healthy thyroid: H; non-neoplastic nodules: NN; follicular adenomas: FA; thyroid cancer: TC; bar: median; box: Q1-Q3 interquartile range; whiskers: non-outlier min-max range; asterisk: outlier. P value was obtained using the Mann-Whitney-Wilcoxon test. Metabolites are divided into four groups: (a) all thyroid lesions present different metabolite level from healthy thyroid tissue, while no significant difference can be found between thyroid lesions; (b) biomarker candidates specific to TC; (c) metabolites showing differences between two thyroid lesion groups considered as benign NN and FA. Note that FA behaves more similar to TC (malignant) than to benign NN, (d) metabolites showing intermediate character of FA.

