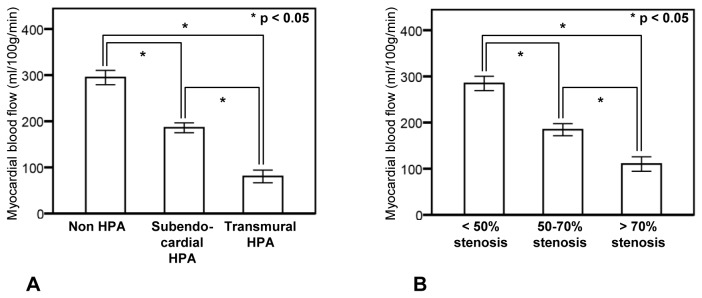
Figure 3. Qualitative and quantitative assessment of stress dynamic CT perfusion imaging and coronary artery stenosis.

A: Relationship between the transmural extent of hypoperfusion area and myocardial blood flow. B: Relationship between coronary artery stenosis and myocardial blood flow. Boxes with error bars indicate mean values ± standard error. Myocardial blood flow was significantly decreased as the severity of the transmural extent of the hypoperfusion area (HPA) increased from non-HPA to transmural HPA (P < 0.05). Myocardial blood flow was significantly decreased as the severity of coronary stenosis increased (P < 0.05).
