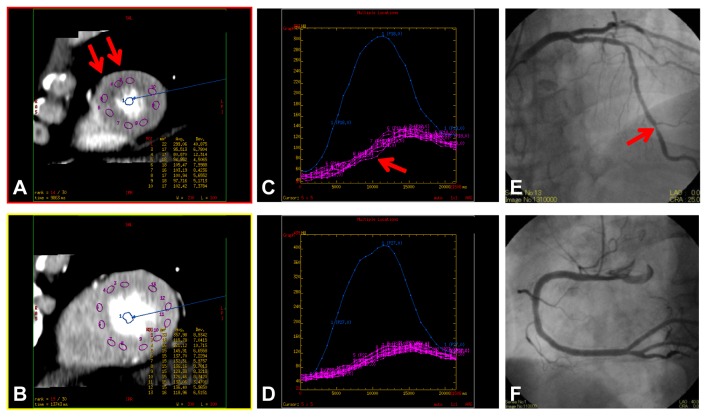
Figure 4. Qualitative and quantitative assessment of myocardial perfusion.
An asymptomatic patient in his 60’s with coronary artery disease. Figures 4A and 4B show cardiac short-axis views at the apical and the mid-ventricular level, respectively. The corresponding time attenuation curves within the regions of interest at the 2 levels (C and D, respectively) show a slight delay in contrast enhancement (red arrow, C) in subendocardial HPA in the apical region (red arrow, A), indicating lower myocardial blood flow. Catheter coronary angiography reveals moderate (50–70%) stenosis in the distal portion of the left anterior descending artery (red arrow, E) and no stenosis in the right coronary artery (F).

