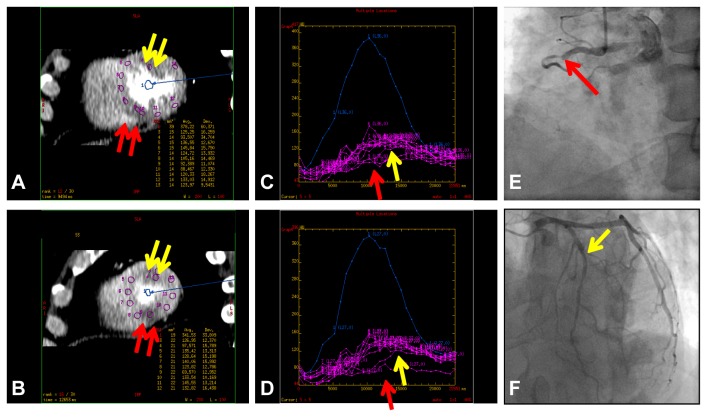
Figure 5. A patient in his 50’s with effort angina.
(A and B) Short-axis images of stress dynamic CTP imaging show subendocardial HPA (yellow arrow) in the anterior segments and transmural HPA in the inferoseptal segments (red arrow). (C and D) The corresponding time attenuation curves of them reveal late (yellow arrow) and low (red arrow) contrast enhancement patterns and low myocardial blood flow in the HPAs. (E and F) Catheter coronary angiography reveals severe (90%) stenosis at the second diagonal branch (yellow arrow, F) and total occlusion in the proximal portion of the right coronary artery with collateral artery via the left circumflex artery (red arrow, E).

