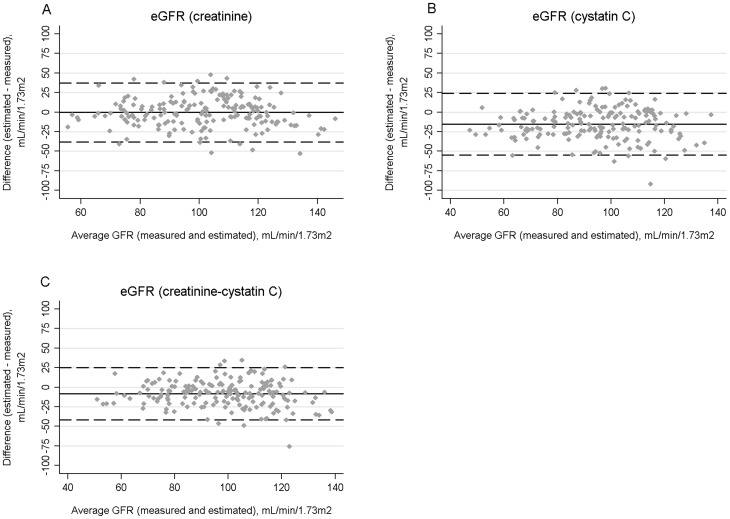
Figure 1. Bland-Altman plots for estimated and measured glomerular filtration rate (GFR) in HIV-positive participants using the CKD-EPI equations for serum creatinine (A), cystatin C (B), or both biomarkers (C).
The average GFR (measured and estimated) is shown on the X axes. Bias, defined as the difference between estimated and measured GFR, is displayed on the Y axes. The average biases are represented by the horizontal solid lines and the horizontal dashed lines represent 2 standard deviations above and below the averages.

