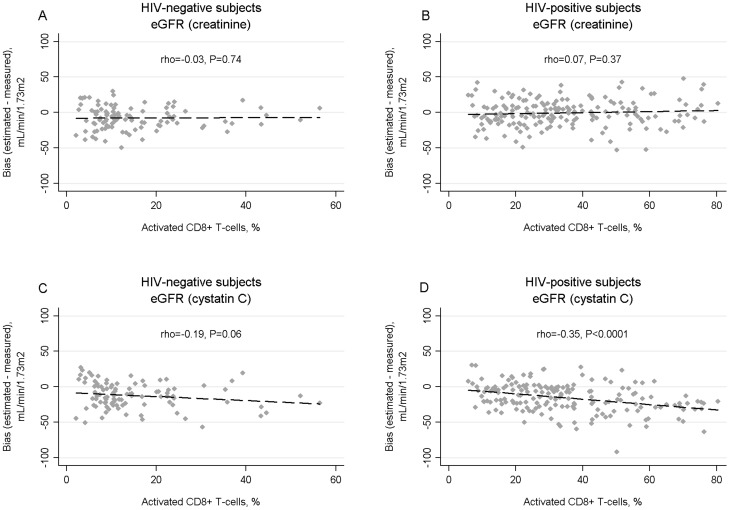
Figure 3. Correlation of estimated glomerular filtration rate (eGFR) bias, defined as the difference between eGFR and measured GFR, with percentage of activated CD8 T cells (CD38+ and HLA-DR+) using the creatine-based CKD-EPI equation in HIV-negative (A) and HIV-positive (B) subjects, and the cystatin C-based CKD-EPI equation in HIV negative (C) and HIV-positive (D) subjects.
The percentage of CD8+ T cells with an activated phenotype is shown on the X axes (note, different scales for HIV-positive and HIV-negative groups). Rho is the spearman rank correlation coefficient, which may vary between −1 and 1. The dashed lines represent least-squares regression lines.

