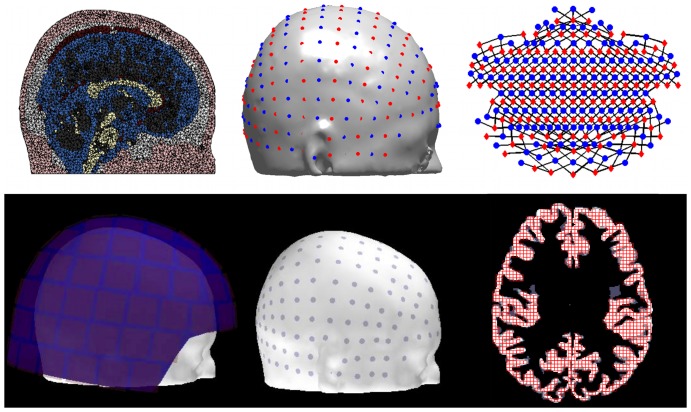
Figure 1. Imaging model design.
Top row: Left, example slice through volumetric head mesh model. Color indicates tissue type. Center, Optode locations on the head model, red indicates sources, blue indicates detectors. Right, map with black lines showing source-detector pairs. Red diamonds are optical sources, blue circles are detectors. Bottom row: Left, MEG sensor helmet and head positioning. Center, locations of EEG electrodes on the scalp. Right, fMRI horizontal slice. Gray scale shows gray matter over three high-resolution anatomical voxels. Red grid shows the size and locations of voxels used.

