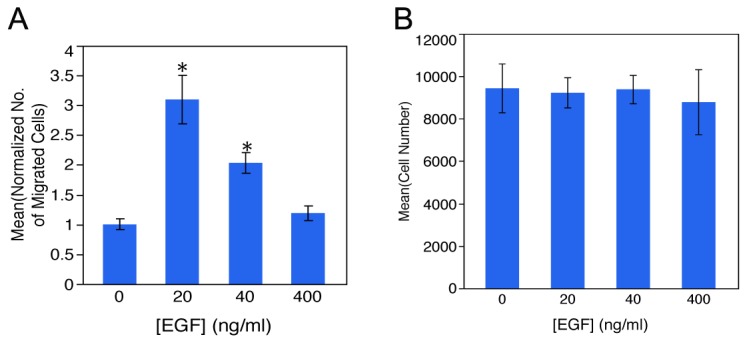
Figure 3. Boyden Chamber analysis of RPCs to establish optimal physiologic range of EGF concentrations.

The Boyden chamber provided a high throughput screen to analyze EGF concentrations and exposure times. A) Demonstrates an optimal physiologic level of EGF, which facilitated significant RPC migration over 24hrs. Analysis of RPCs incubated in Boyden Chambers containing either 20ng/ml or 40ng/ml EGF revealed significant migration compared to control, 3.0981 ± 0.40 (p=<.0.0001*), 2.0340 ± 0.18 (p=0.0001*) respectively. While 400ng increased migration, this did not result in significant migration above control, 1.1885 ± 0.12 (p=0.7816). Pooled data from n=6 chambers are presented as normalized mean ± SEM. B) Analysis of RPC number following incubation in each EGF concentration revealed that there was no change in cell proliferation measured via MTT assay.
