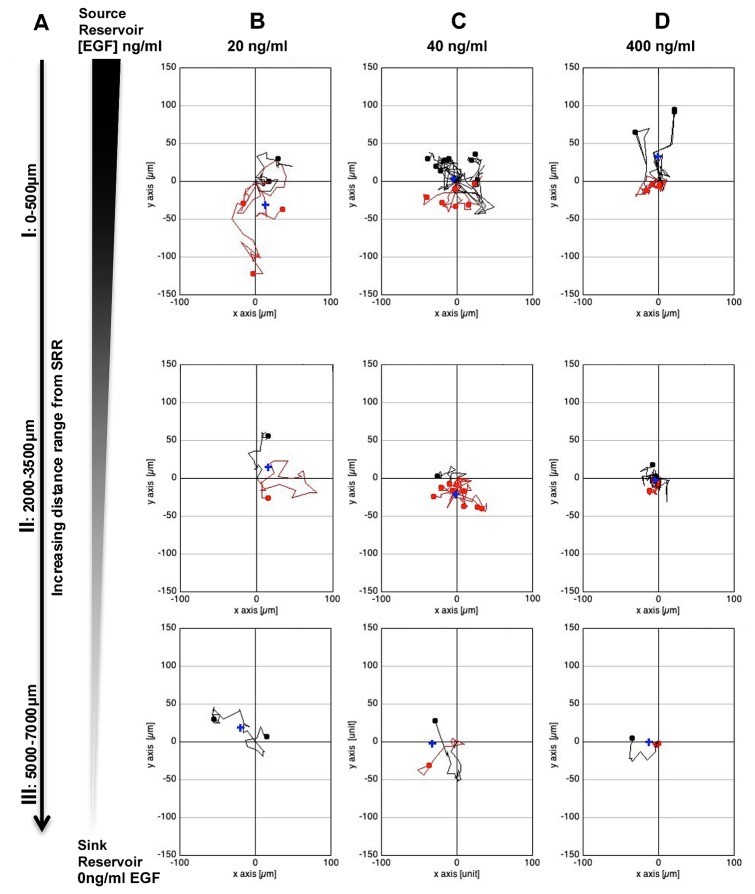
Figure 6. Trajectory analysis paradigm for RPC migration in microfluidic gradients at increasing distances from the EGF source.
Positional tracking of RPCs migrating in steady state gradients of EGF generated in a 13mm bridged μ-lane device over a 24hr period was visualized using Ibidi Migration software to generate wind-rose plots (A-D). A) Cell tracking results are depicted at increasing distances from the source reservoir: 0-500μm (I), 2000-3500μm (II), 5000-7000μm (III). B-D) Depiction of RPC trajectory plot mapping in steady-state gradients of 20, 40, and 400ng/ml EGF analyzed from source reservoirs to sink reservoirs. A trend of reduced chemokinetic migratory dynamics can be observed with increasing EGF concentrations up to 400ng/ml. Red and black traces indicate RPCs with negative and positive COM, respectively.Statistics resulting from trajectory data depicted here analyzed for maximum distance and center of mass are reported below. The x- and y-axis denote RPC displacement in horizontal and vertical directions, respectively.

