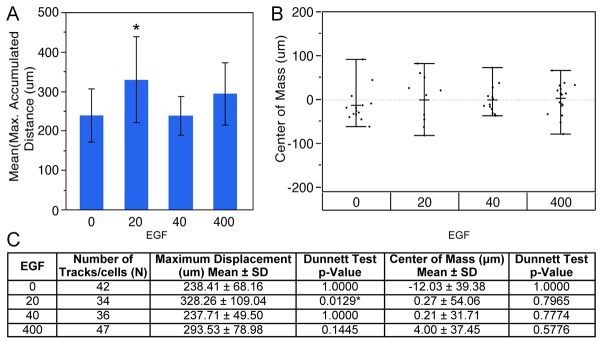
Figure 7. Analysis of RPC maximum accumulated distance and center of mass dynamics in microfluidic bridged μ-lane EGF gradients.

A) RPC maximum displacement was analyzed in the absence or presence of varying EGF gradients measured post-steady-state within a 24hr period, and results are expressed as mean ± standard deviation for three independent studies per EGF concentration. Only RPCs cultured in 20ng/ml EGF exhibited significantly higher maximum displacement compared to cells in the control microchannel (328.26 ± 109.04, p=0.0166), Dunnett Test. B) Similar measurements for center of mass (COM) of RPCs yielded non-significant differences in both means and medians among test groups (Brown-Forsythe, p=0.1622) indicating no significant chemotactic or directed migration between EGF concentrations. This reveals that the increased Maximum accumulated distance response can be defined as chemokinetic. C) displays averaged maximum distance accumulated and COM of RPCs in defined EGF concentration gradients with their respective standard deviation and p-values results from the Dunnett statistical test. Significant p-values are denoted with an asterisk.
