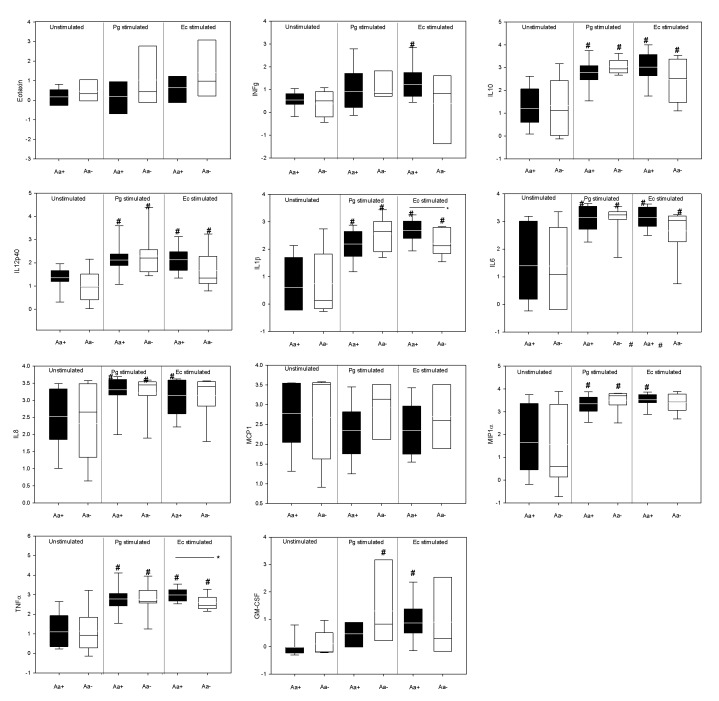
Figure 4. Systemic LPS-induced cyto/chemokine values in both groups.
Values are reported as normalized log pg/mL. Box-plots show the mean (horizontal line), inter-quartile range (box), 5th -95th percentiles (vertical lines). *Indicates statistically significant differences between groups (Aa+ and Aa-) by t-test (p<0.05). #Indicates statistically significant differences within groups regarding TLR stimulation by One-way ANOVA (p<0.05).

