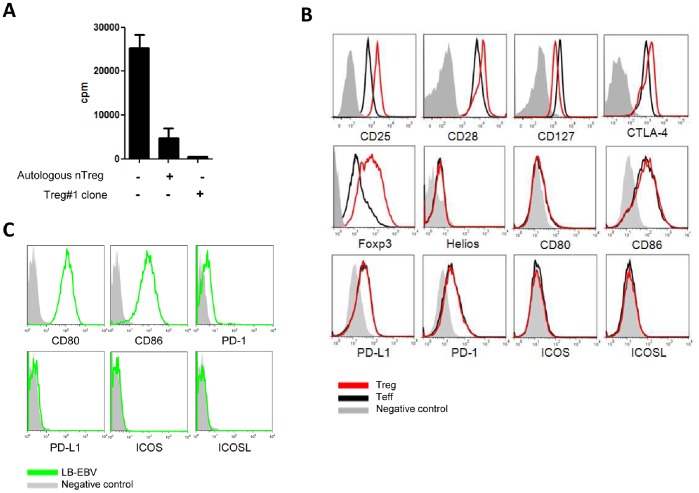
Figure 1. Phenotypic and functional analyses of human regulatory T cells (Treg#1) and allogeneic human B-EBV cells phenotype.
(A) Proliferation of CD4+CD25− T cells stimulated with irradiated allogeneic PBMC at day 5 in presence or not of autologous natural CD4+CD25HighCD127Low regulatory T cells (nTreg) or clone Treg#1 at a 1∶1 ratio. **P<0.01. (B) The phenotype of Treg#1 clone is compared to effector T cell (Teff) by Flow Cytometry. Control: filled gray, Teff: black line and Treg#1: red line. (C) Costimulatory molecule expression analysis on CD20+ B-EBV lymphocytes (pool of 3 cell lines). Control: filled gray and B-EBV cells: green line.

