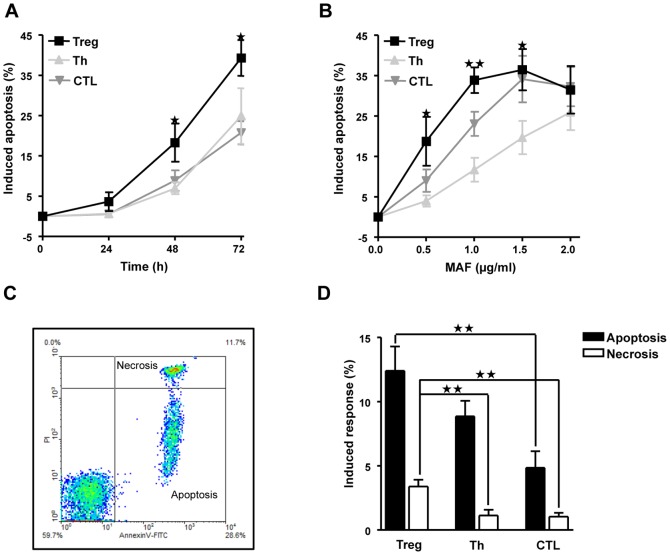
Figure 2. Cyctotoxicity of mafosfamide in Treg, Th and CTL.
A, Time course of the induction of apoptosis, which was determined by subG1 quantification. Cells were treated with a dose of 0.5 µg/ml mafosfamide and cells were subjected to flow cytometry at the times indicated. B, Dose response of apoptosis induction in Treg, Th and CTL. The fraction of subG1 was determined 48 h after mafosfamide treatment. The asteriks label the measure points that show a significant difference to Th and CTL, except for the 1.5 µg/ml MAF level, for which significance was obtained only against Th. C, Amount of apoptosis (annexinV positive, PI negative fraction) and necrosis (annexinV positive, PI positive fraction), as determined by the annexinV/PI flow cytometry assay. Treg were treated with 0.5 µg/ml mafosfamide. D, Yield of apoptosis and necrosis in Treg, Th and CTL treated with 0.5 µg/ml. Cells were harvested 24 h after the onset of treatment. Data are the mean of at least three independent experiments.

