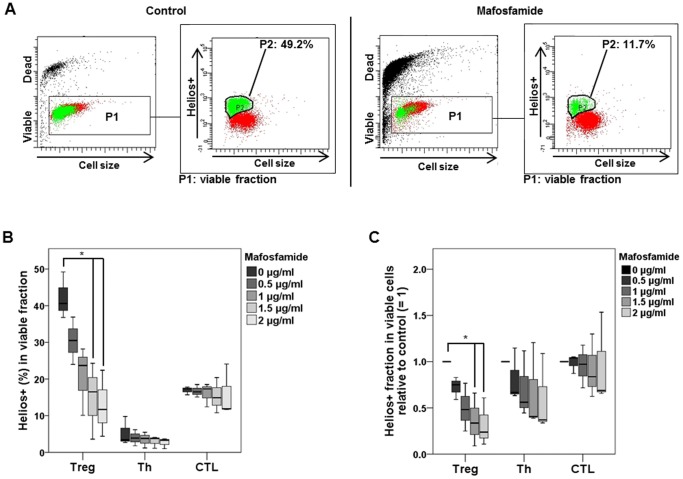
Figure 5. Helios expression in viable Treg.
A, Dot plots of control and mafosfamide (2 µg/ml, 48 h) treated Treg. The living fraction was gated (P1) and Helios+ cells were marked green in this fraction (designed as P2). Left panel shows representative graphs of untreated Treg; right panel of treated Treg. B, Quantification of Helios expressing Treg, Th and CTL determined 48 h after treatment with 2 µg/ml mafosfamide. C, Quantification of data with the non-treated control set to 1. * p<0.05 significance.

